How to Compute the Coefficient of Variation in Excel

The coefficient of variation (CV) is a statistical measure that expresses the standard deviation as a percentage of the mean. It’s a useful tool for comparing the relative variability of different datasets, regardless of their units of measurement. In this guide, we’ll show you how to easily calculate the coefficient of variation in Excel.
Understanding Coefficient of Variation
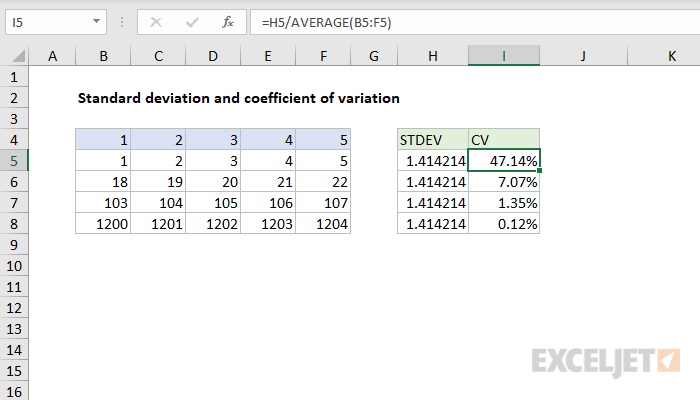
The CV is calculated using the following formula:
CV = (Standard Deviation / Mean) * 100%
It essentially tells you how much variation there is in your data relative to the average. A higher CV indicates greater variability, while a lower CV indicates less variability.
Steps to Calculate CV in Excel
-
-
Organize Your Data: Ensure your data is in a single column or row.
-
Calculate the Mean: In an empty cell, use the AVERAGE function to calculate the mean of your data. For example:
=AVERAGE(A1:A10)
-

-
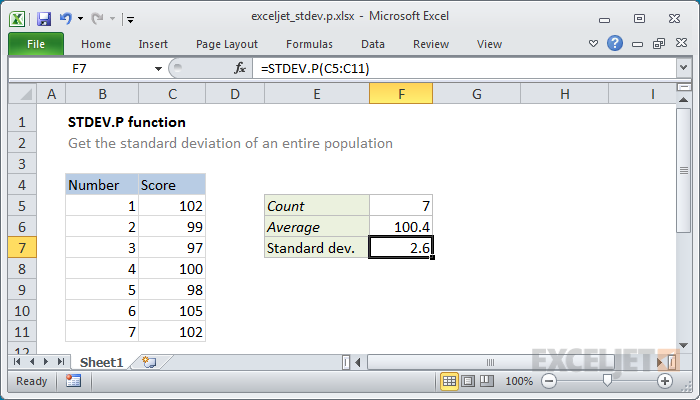
- Calculate the Standard Deviation: In another empty cell, use the STDEV.P function (for population standard deviation) or STDEV.S function (for sample standard deviation) to calculate the standard deviation of your data. For example:
=STDEV.P(A1:A10)
- Calculate the Standard Deviation: In another empty cell, use the STDEV.P function (for population standard deviation) or STDEV.S function (for sample standard deviation) to calculate the standard deviation of your data. For example:

-
- Calculate the CV: In a final cell, divide the standard deviation by the mean and multiply by 100 to express the result as a percentage. For example:
=(B1/B2)*100(assuming the mean is in cell B2 and the standard deviation is in cell B1)
- Calculate the CV: In a final cell, divide the standard deviation by the mean and multiply by 100 to express the result as a percentage. For example:

Example
Let’s say you have the following data set representing the heights of 10 students:
| Height (cm) | |—|—| | 160 | | 165 | | 170 | | 158 | | 172 | | 163 | | 168 | | 175 | | 161 | | 166 |
Following the steps above, you would calculate:
- Mean: 165.8 cm
- Standard Deviation: 5.63 cm
- Coefficient of Variation: 3.39%
Interpreting the CV
In this example, the coefficient of variation of 3.39% indicates that the heights of the students have relatively low variability compared to the mean height.
Important Considerations
- Units: The CV is a unitless measure, making it useful for comparing datasets with different units.
- Zero Mean: The CV is undefined when the mean is zero.
- Outliers: Outliers can significantly affect the CV. Consider removing them if they are not representative of your data.
Key Applications
- Finance: Comparing the risk of different investments.
- Quality Control: Assessing the consistency of a manufacturing process.
- Biology: Comparing the variability of different populations or samples.
By following this guide, you can easily calculate the coefficient of variation in Excel and gain valuable insights into the variability of your data.


Leave a Reply