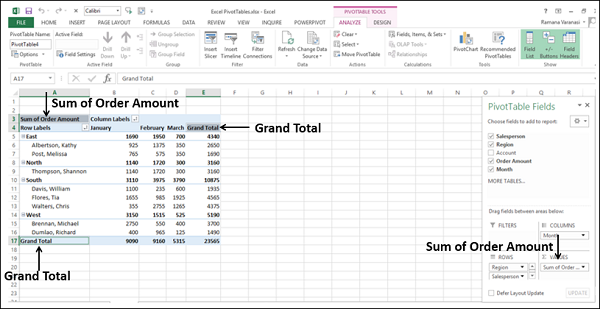
Becoming Proficient with Pivot Tables: The Comprehensive Guide for Excel Users

PivotTables are a powerful data analysis tool in Excel that can transform raw data into meaningful summaries and reports. They allow you to quickly summarize, analyze, explore, and present your data in a variety of ways. This comprehensive guide will walk you through the ins and outs of PivotTables, from creating them to utilizing advanced features.
Why PivotTables Are Essential for Data Analysis
- Data Summarization: Quickly summarize large datasets by grouping and aggregating data based on different categories.
- Data Exploration: Easily explore relationships between different variables in your data.
- Customizable Reports: Create dynamic reports that can be filtered, sorted, and formatted to suit your needs.
- Time-Saving: Automate repetitive data analysis tasks and generate reports in seconds.
- Interactive Analysis: PivotTables allow you to interact with your data by drilling down into specific details.
How to Create a PivotTable
-
Prepare Your Data: Ensure your data is organized in a tabular format with clear headers for each column.
-
Insert PivotTable:
- Go to the “Insert” tab in the ribbon and click “PivotTable.”
- Select the range of data you want to include in the PivotTable.
- Choose whether to create the PivotTable in a new worksheet or an existing one.

- Arrange Fields:
- Drag and drop fields from the PivotTable Field List into the “Rows,” “Columns,” “Values,” and “Filters” areas.
- Experiment with different combinations to find the insights you’re looking for.

- Customize Your PivotTable:
- Change the layout, formatting, and calculations to suit your needs.
- Add slicers, timelines, and other interactive elements to filter and explore your data.
Advanced PivotTable Techniques
- Calculated Fields: Create custom calculations based on your PivotTable data.
- Grouping: Group data by date, number ranges, or other criteria.
- Filtering: Filter data to focus on specific categories or values.
- Sorting: Sort data in ascending or descending order.
- Charts: Create charts based on your PivotTable data to visualize your findings.
Tips for Using PivotTables Effectively
- Start with a Clear Question: Define what you want to learn from your data before creating a PivotTable.
- Choose the Right Fields: Carefully select the fields you want to include in your PivotTable.
- Experiment: Try different combinations of fields and arrangements to discover hidden insights.
- Format for Clarity: Use clear labels, appropriate number formats, and conditional formatting to make your PivotTable easy to understand.
- Share Your Findings: Export your PivotTable to a new worksheet or create a PivotChart to share your results with others.
Conclusion
PivotTables are a powerful tool for data analysis in Excel. By mastering their features and techniques, you can unlock valuable insights from your data and make informed decisions. Whether you’re a beginner or an experienced user, PivotTables can help you take your data analysis skills to the next level.
Related articles
»10 Steps to Make a Pivot Chart in Excel
» How to Limit Rows and Columns in an Excel Worksheet
» Troubleshooting “OLE Action Excel” Error in Microsoft Excel
» Ways To Alternate Row Colors in Excel [Guide]

