SAAC's Team
July 2, 2024
Microsoft Office Excel Quick Reference Guide

Microsoft Excel is a powerhouse for data analysis, organization, and calculation. Whether you’re a beginner or a seasoned user, this cheat sheet will equip you with essential shortcuts, formulas, and tips to boost your productivity and unlock the full potential of Excel.
1. Navigation and Selection

- Move between cells: Arrow keys, Tab, Enter
- Select a range: Click and drag, Shift + arrow keys
- Select entire row/column: Click row/column header
- Select entire worksheet: Ctrl + A
- Go to a specific cell: Ctrl + G
2. Basic Formulas and Functions

- SUM:
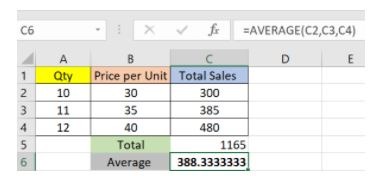
=SUM(range)Adds up values in a range - AVERAGE:
=AVERAGE(range)Calculates the average of values in a range - COUNT:
=COUNT(range)Counts the number of cells with numerical values in a range - MAX:
=MAX(range)Finds the highest value in a range - MIN:
=MIN(range)Finds the lowest value in a range - IF:
=IF(logical_test, value_if_true, value_if_false)Performs a logical test and returns a value based on the result
3. Advanced Formulas and Functions

- VLOOKUP:
=VLOOKUP(lookup_value, table_array, col_index_num, [range_lookup])Looks up a value in a table and returns a corresponding value from another column - INDEX-MATCH:
=INDEX(return_array, MATCH(lookup_value, lookup_array, [match_type]))A more flexible alternative to VLOOKUP - SUMIF:
=SUMIF(range, criteria, [sum_range])Adds up values in a range that meet a specific criterion - COUNTIF:
=COUNTIF(range, criteria)Counts the number of cells in a range that meet a specific criterion - AVERAGEIF:
=AVERAGEIF(range, criteria, [average_range])Calculates the average of values in a range that meet a specific criterion
4. Formatting

- Number Formats: Currency, percentage, date, time, etc.
- Conditional Formatting: Highlight cells based on specific criteria.
- Cell Styles: Apply pre-defined or custom styles to cells.
- Alignment: Left, center, right, top, middle, bottom
- Borders and Shading: Add visual emphasis to cells or ranges.
5. Charts and Graphs

- Insert Chart: Select data and go to “Insert” > “Recommended Charts” or choose a specific chart type.
- Customize Chart: Change chart titles, axis labels, colors, and styles.
- Chart Types: Column, bar, line, pie, scatter, area, etc.
- Sparklines: Miniature charts within cells that visualize data trends.
6. Data Analysis Tools
- Data Analysis ToolPak: An add-in that provides various statistical and engineering analysis tools.
- PivotTables: Summarize and analyze large datasets quickly and easily.
- Goal Seek: Find the input value needed to achieve a specific target output.
- Solver: Find optimal solutions for complex problems with multiple constraints.
7. Shortcuts and Tips
- AutoFill: Double-click the fill handle to quickly fill a series of cells.
- Paste Special: Choose how to paste data (values, formulas, formatting, etc.).
- F4: Toggle between relative, absolute, and mixed cell references.
- Ctrl + `: Display formulas in cells.
- Alt + Enter: Insert a line break within a cell.
By mastering these tips and tricks, you’ll be well on your way to becoming an Excel expert. Remember, practice is key, so don’t hesitate to experiment and explore the vast array of features Excel has to offer.
Subscribe
Login
0 Comments
Oldest

