Excel Data Analysis: Charting, Modeling, Regression, and Beyond

Excel is a powerhouse for data analysis, offering a wide range of tools and features to transform raw data into actionable insights. This comprehensive guide will delve into the various aspects of data analysis in Excel, from basic visualization to advanced modeling and regression techniques.
Why Excel for Data Analysis?
- Accessibility: Excel is widely available and familiar to many users.
- Versatility: It offers a variety of tools for data cleaning, transformation, analysis, and visualization.
- Ease of Use: Its intuitive interface makes it accessible to both beginners and experienced analysts.
- Integration: Excel seamlessly integrates with other Microsoft Office applications and external data sources.
Key Data Analysis Techniques in Excel
- Data Cleaning and Preparation:

- Removing Duplicates: Identify and remove duplicate entries to ensure data accuracy.
- Handling Missing Values: Fill in missing values with appropriate techniques like mean imputation or regression.
- Text to Columns: Split text data into multiple columns for easier analysis.
- Data Validation: Set rules to ensure data integrity and consistency.
- Data Visualization:

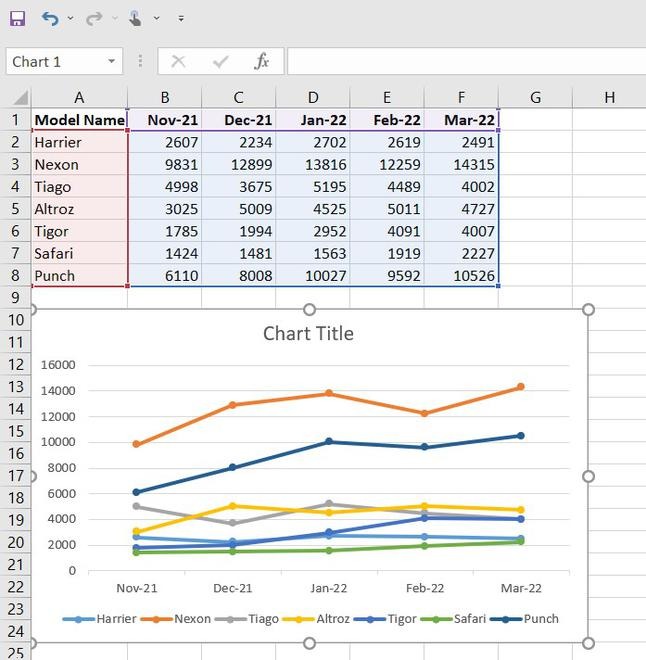
- Charts and Graphs: Create various charts (bar, column, line, pie, scatter) to visualize data trends and patterns.
- Sparklines: Add miniature charts within cells to show trends over time.
- Conditional Formatting: Highlight specific data points based on conditions.
- Data Modeling:

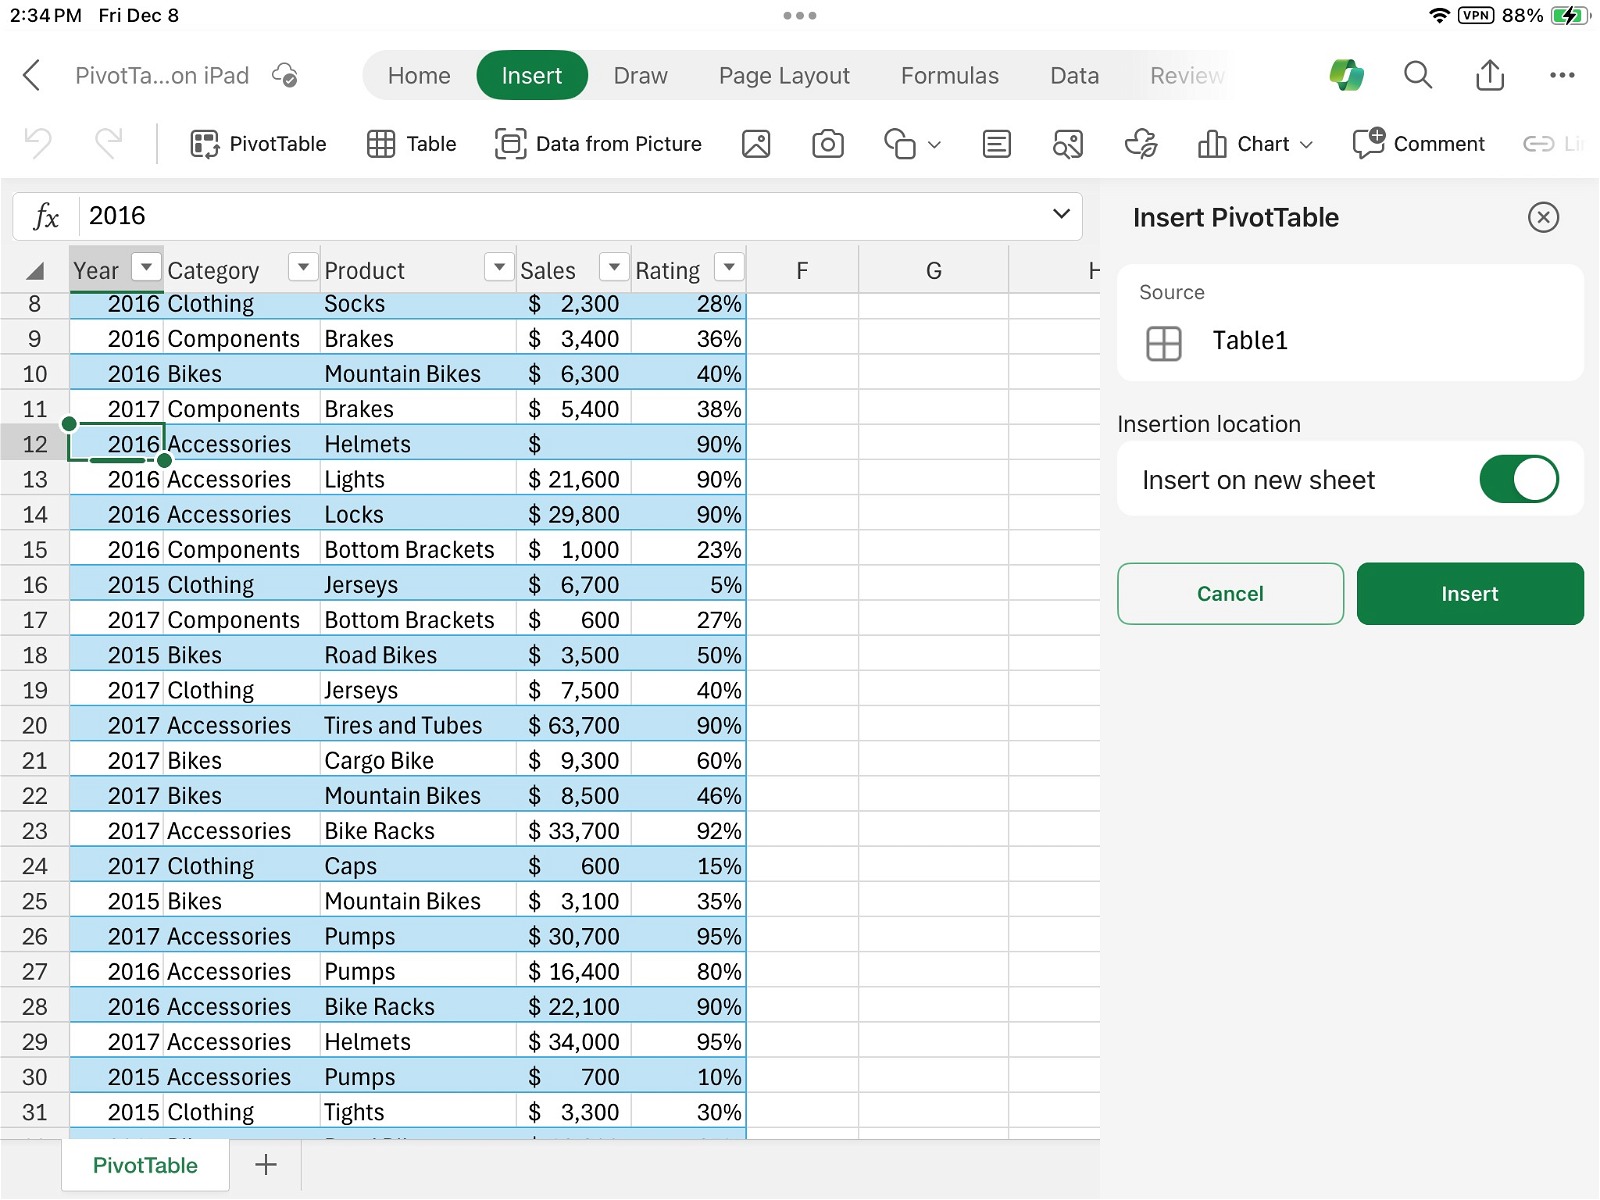
- PivotTables: Summarize and analyze large datasets by aggregating data based on different categories.
- What-If Analysis: Explore different scenarios by changing input values and observing the impact on output.
- Goal Seek: Find the input value needed to achieve a desired output.
- Statistical Analysis:
- Descriptive Statistics: Calculate measures like mean, median, mode, standard deviation, and variance.
- Regression Analysis: Determine the relationship between variables and predict future outcomes.
- Hypothesis Testing: Test hypotheses about population parameters using t-tests, z-tests, and ANOVA.
- Data Analysis ToolPak: An add-in that provides additional statistical tools.
Advanced Excel Data Analysis Techniques
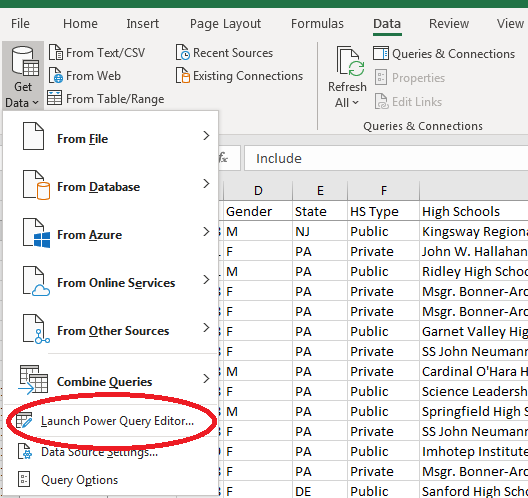
- Power Query:Import, transform, and clean data from various sources.

- Power Pivot: Create sophisticated data models for complex analysis.
- Data Analysis Expressions (DAX): A formula language used in Power Pivot for creating calculated columns and measures.
Tips for Effective Data Analysis in Excel
- Start with Clean Data: Ensure your data is accurate, complete, and consistent before starting your analysis.
- Choose the Right Tools: Select the appropriate Excel functions and features for your specific analysis needs.
- Visualize Your Data: Use charts and graphs to make your findings more accessible and understandable.
- Test Your Assumptions: Don’t rely on intuition alone; use statistical tests to validate your hypotheses.
- Communicate Clearly: Present your findings in a clear and concise manner, using visuals and explanations.
Conclusion
Excel is a versatile tool for data analysis, offering a wide range of features to cater to different needs. By mastering the techniques outlined in this guide, you can unlock the full potential of Excel and gain valuable insights from your data. Whether you’re a beginner or an experienced analyst, Excel can help you make informed decisions and drive your projects forward.
Related articles
» Mastering Data Modeling in Excel: Advanced Techniques and Best Practices
» Beginner’s Guide to Microsoft Excel Online: Manage Data & Create Spreadsheets
» Master Data Manipulation with Excel SUBSTITUTE Function: A Step-by-Step Guide

