How to Calculate a P-Value in Excel: A Comprehensive Guide

The p-value is a crucial statistical measure used in hypothesis testing to determine the significance of your results. Excel provides several ways to calculate p-values, depending on the type of test you’re performing. This guide will walk you through the most common methods, ensuring you can confidently assess the statistical significance of your data.
Understanding P-Values
- In hypothesis testing, the p-value represents the probability of obtaining results as extreme as or more extreme than those observed, assuming the null hypothesis is true.
- A smaller p-value indicates stronger evidence against the null hypothesis, suggesting that your results are statistically significant.
- Typically, a p-value of 0.05 or less is considered statistically significant, meaning there’s a less than 5% chance that your results occurred by chance.
Methods for Calculating P-Values in Excel
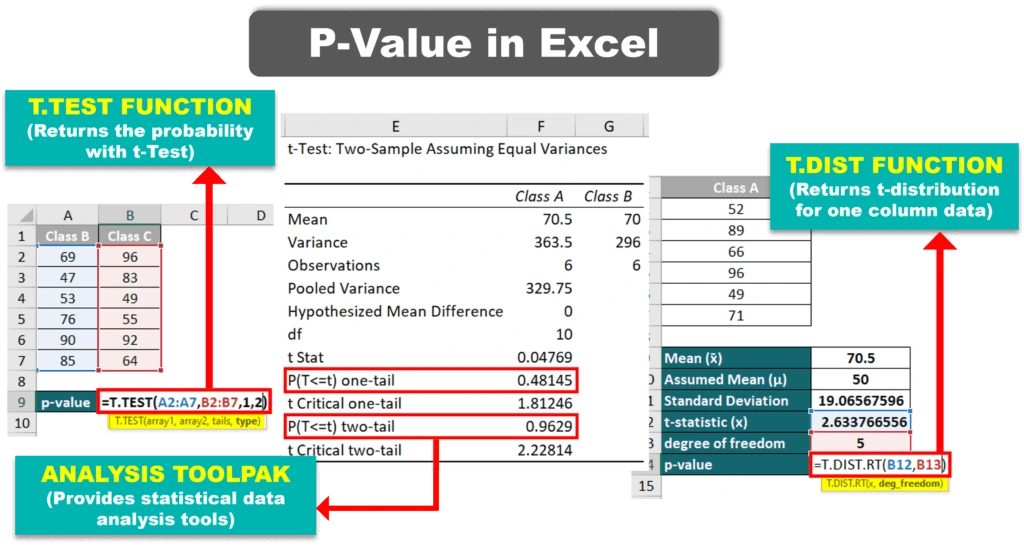
1. T-Test (T.TEST Function)
- Use Case: Comparing the means of two groups to determine if they are significantly different.
- Formula:
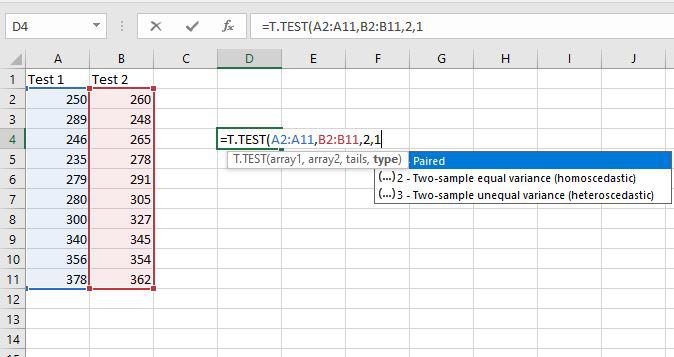
=T.TEST(array1, array2, tails, type)array1: The first set of data.array2: The second set of data.tails: 1 for a one-tailed test, 2 for a two-tailed test.type: 1 for paired, 2 for two-sample equal variance, 3 for two-sample unequal variance.
2. Z-Test (Z.TEST Function)
- Use Case: Testing whether a sample mean is significantly different from a known population mean when the population standard deviation is known.
- Formula:
=Z.TEST(array, x, sigma)array: The range of data.x: The value to test against.sigma: The population standard deviation.
3. Chi-Square Test (CHISQ.TEST Function)
- Use Case: Testing for independence between two categorical variables.
- Formula:
=CHISQ.TEST(actual_range, expected_range)actual_range: The range of observed frequencies.expected_range: The range of expected frequencies.
4. Analysis ToolPak Add-in
- Use Case: Performing various statistical analyses, including t-tests, ANOVA, and regression, with a user-friendly interface.
- How to Enable:
- Go to “File” > “Options” > “Add-ins.”
- Select “Excel Add-ins” and click “Go.”
- Check the box next to “Analysis ToolPak” and click “OK.”
- How to Use:
- Go to the “Data” tab and click “Data Analysis.”
- Choose the appropriate analysis tool and follow the prompts.
Important Considerations
- Assumptions: Each statistical test has specific assumptions that must be met for the p-value to be valid. Ensure your data meets the assumptions of the test you choose.
- Interpretation: Remember that a p-value is just one piece of evidence. Consider it alongside other factors like effect size and practical significance when drawing conclusions.
Conclusion
By mastering these methods for calculating p-values in Excel, you’ll be equipped to assess the statistical significance of your data and make more informed decisions based on your findings.


