How to Create a Frequency Distribution in Excel

A frequency distribution is a powerful tool for summarizing and analyzing data. It shows how often different values or ranges of values occur within a dataset. Excel offers several ways to create frequency distributions, each with its own advantages. This guide will walk you through the most common methods, ensuring you can choose the best approach for your specific needs.
Understanding Frequency Distribution

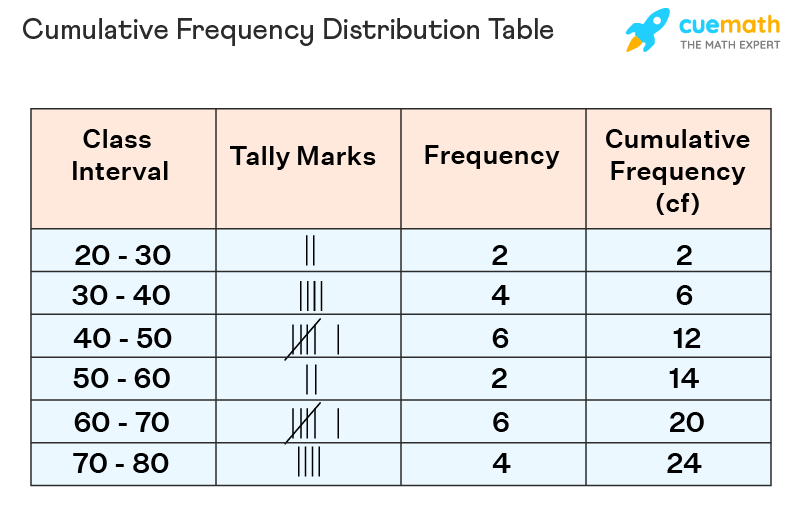
A frequency distribution table typically consists of two columns:
- Bins (or Classes): These represent the intervals or ranges of values you want to group your data into.
- Frequency: This indicates the number of data points that fall within each bin.
Methods for Creating Frequency Distributions in Excel
1. Histogram Tool (Data Analysis ToolPak)

- Ideal for: Quickly creating a frequency distribution table and chart (histogram).
- Steps:
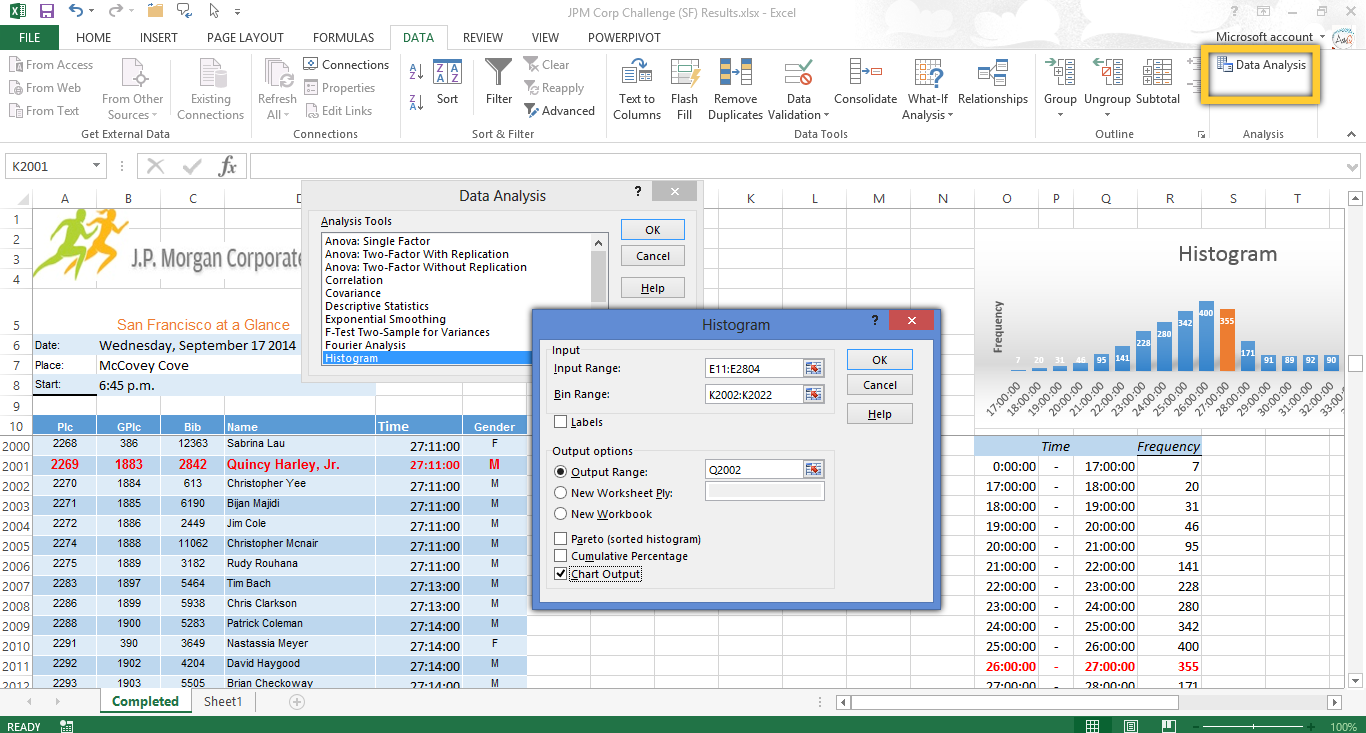
- Enable the Data Analysis ToolPak (if not already enabled). Go to “File” > “Options” > “Add-ins.” Select “Excel Add-ins” and click “Go.” Check the box next to “Analysis ToolPak” and click “OK.”
- Go to the “Data” tab and click “Data Analysis.”
- Select “Histogram” and click “OK.”
- Specify the input range (your data), bin range (optional), and output options.
- Click “OK” to generate the frequency distribution table and histogram.
2. PivotTable

- Ideal for: Creating interactive frequency distributions with flexible grouping and filtering options.
- Steps:
- Select your data.
- Go to the “Insert” tab and click “PivotTable.”
- Drag the field you want to analyze (e.g., “Sales”) to the “Rows” area.
- Drag the same field to the “Values” area and change the calculation to “Count.”
- Right-click on a value in the “Rows” area and select “Group.”
- Specify the bin size or starting and ending values for your bins.
- Click “OK” to create the frequency distribution.
3. COUNTIFS Function

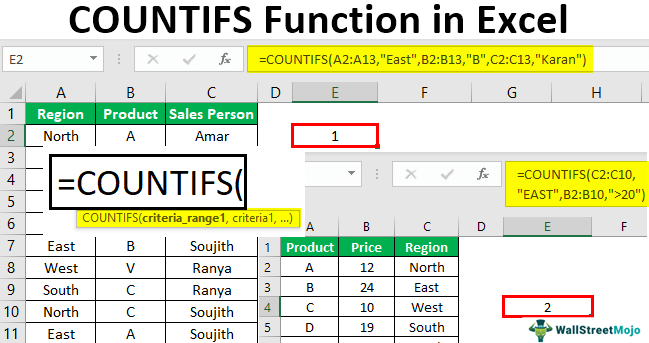
- Ideal for: Creating simple frequency distributions with specific criteria.
- Formula:
=COUNTIFS(criteria_range1, criteria1, [criteria_range2, criteria2], ...)criteria_range: The range of cells you want to evaluate.criteria: The condition that cells must meet to be counted.
4. FREQUENCY Function (Array Formula)

- Ideal for: Creating frequency distributions with non-uniform bin sizes.
- Formula:
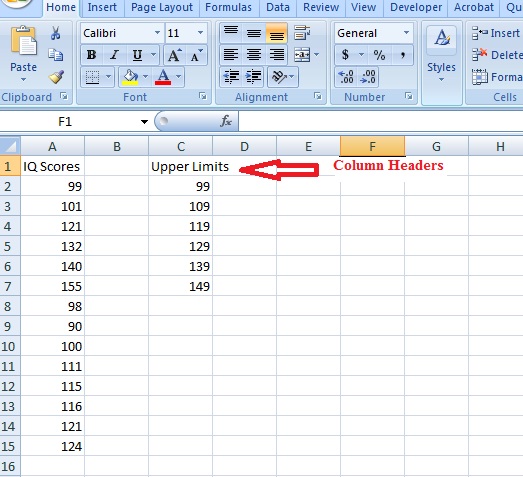
=FREQUENCY(data_array, bins_array)data_array: The range of cells containing your data.bins_array: The range of cells containing the upper limits of your bins.- Note: This is an array formula, so you must press Ctrl+Shift+Enter after entering it.
Tips and Best Practices
- Choose the Right Method: Select the method that best suits your data and desired output (table, chart, or both).
- Define Meaningful Bins: Choose bin sizes that make sense for your data and the analysis you want to perform.
- Label Clearly: Label your bins and frequencies clearly to avoid confusion.
- Visualize Your Results: Consider creating a histogram or other chart to visualize your frequency distribution.
By mastering these techniques, you can effectively create frequency distributions in Excel, gaining valuable insights into your data and making informed decisions.

