How to Perform Break-Even Analysis in Excel
Introduction
Break-even analysis is a financial tool that businesses use to determine the point at which their total revenue equals their total costs. This point is known as the break-even point. The break-even point is important because it tells businesses how much they need to sell in order to cover their costs and start making a profit.
Excel is a powerful tool that can be used to calculate break-even analysis. In this article, we will show you how to calculate break-even analysis in Excel using two methods: the formula method and the goal seek method.
Method 1: Using the Formula
-
Enter your data. The first step is to enter your data into Excel. This data will include your fixed costs, variable costs, and selling price.
- Fixed costs are costs that do not change with the level of production or sales. Examples of fixed costs include rent, salaries, and insurance.
- Variable costs are costs that change with the level of production or sales. Examples of variable costs include materials, labor, and shipping.
- Selling price is the price at which you sell your product or service.
-
Create a formula. Once you have entered your data, you can create a formula to calculate the break-even point. The formula is as follows:
Break-even point = Fixed costs / (Selling price - Variable costs)
-
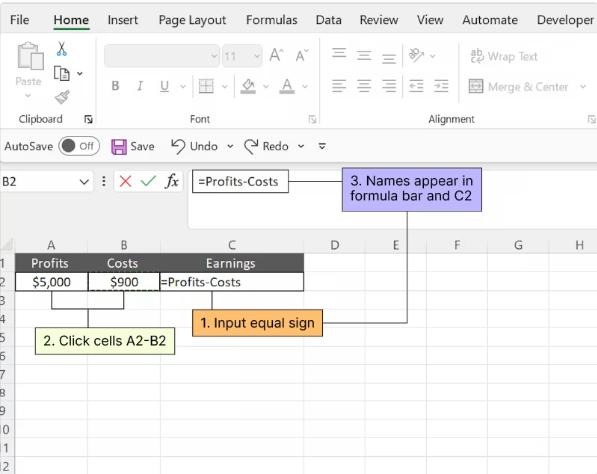
Enter the formula into Excel. Enter the formula into a cell in Excel. For example, you could enter the formula into cell B5.
-
Format the cell. Format the cell to display the break-even point in dollars. You can do this by selecting the cell and then clicking on the Number tab. In the Number group, select Currency.
Method 2: Using Goal Seek
-
Enter your data. The first step is to enter your data into Excel. This data will include your fixed costs, variable costs, and selling price.
-
Set a goal. The next step is to set a goal. The goal is the value that you want to achieve. In this case, the goal is to achieve a profit of zero.
-
Set the changing cell. The changing cell is the cell that you will change in order to achieve the goal. In this case, the changing cell is the cell that contains the number of units sold.
-
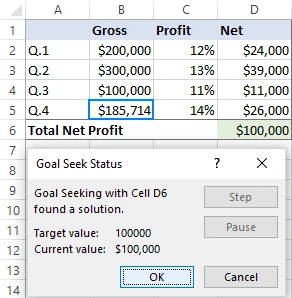
Activate the Goal Seek tool. Activate the Goal Seek tool by clicking on the Data tab and then clicking on the What-If Analysis group. In the What-If Analysis group, click on Goal Seek.
-
Enter the goal values. Enter the goal values in the Goal Seek dialog box. The goal value is the value that you want to achieve. In this case, the goal value is 0.
-
Enter the changing cell. Enter the changing cell in the Goal Seek dialog box. The changing cell is the cell that you will change in order to achieve the goal. In this case, the changing cell is the cell that contains the number of units sold.
-
Click on OK. Click on OK to run the Goal Seek tool. The Goal Seek tool will change the value of the changing cell until the goal value is achieved.
Conclusion
Break-even analysis is a valuable tool that can help businesses make informed decisions. By using Excel, you can easily calculate your break-even point and use this information to plan for the future.
Additional tips
- Use a break-even analysis chart to visualize your break-even point.
- Use break-even analysis to compare different pricing strategies.
- Use break-even analysis to evaluate the risk of new products or services.


