How to Access and Use Activity Monitor on macOS
While Windows users rely on the Task Manager to monitor system performance and manage applications, macOS has a powerful equivalent called Activity Monitor. Activity Monitor allows Mac users to view and control running applications and processes, monitor CPU and memory usage, network activity, and more. This guide will take you through using Activity Monitor as a task manager on macOS, with step-by-step instructions and images for clarity.
Accessing Activity Monitor on macOS
The first step in using Activity Monitor is accessing it on your Mac. Here’s how you can do it:
- Step 1: Open Finder.
- Step 2: Navigate to Applications > Utilities.
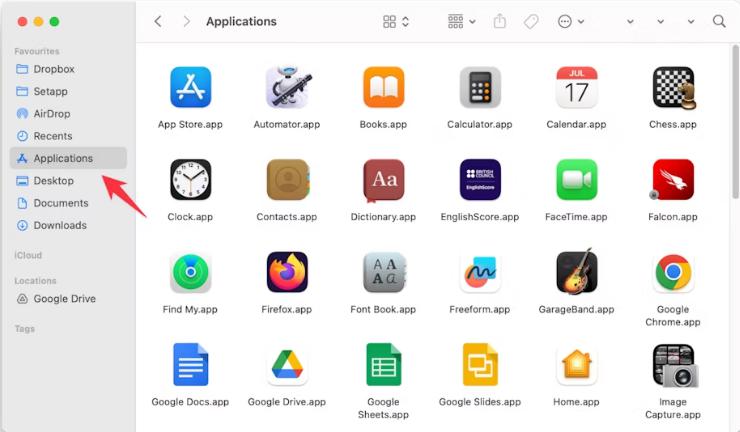
- Step 3: Double-click on Activity Monitor to launch it.
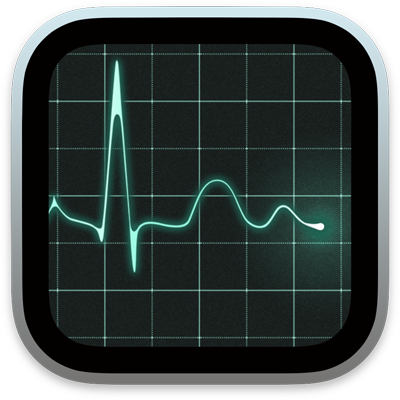
Alternatively, you can quickly open Activity Monitor by using Spotlight Search. Press Command + Space to open Spotlight, type “Activity Monitor,” and press Enter to open the app.
Once open, Activity Monitor provides an overview of your Mac’s processes and resource usage.
Understanding Activity Monitor’s Main Tabs
Activity Monitor is divided into five main tabs that provide insights into different aspects of your Mac’s performance. Each tab displays data in real-time, allowing you to monitor and troubleshoot your system efficiently.
1. CPU Tab
The CPU tab shows information about how much processing power is being used by various applications and background processes. Key details displayed in the CPU tab include:
- % CPU: The percentage of the CPU used by each process.
- Threads: The number of active threads in each process.
- Idle CPU: How much of your CPU power is currently not in use.

You can use this tab to see which applications or processes are consuming the most CPU. If an application is causing your Mac to run slowly, you’ll likely see it at the top of the CPU usage list.
2. Memory Tab
The Memory tab provides information on your Mac’s RAM usage. This tab is crucial for understanding if you are running out of memory, which can affect performance. Important data here includes:
- Memory Used: The total amount of RAM in use.
- App Memory: The amount of memory being used by active applications.
- Wired Memory: Essential system functions that cannot be compressed or swapped to disk.
- Swap Used: Memory temporarily stored on the disk when physical RAM is fully utilized.
This tab helps identify memory-heavy applications that may be slowing down your Mac. If you often experience lag, consider checking this tab to see if you need to close some applications or upgrade your RAM.
3. Energy Tab
The Energy tab displays the energy impact of each app and process, especially useful for MacBook users who want to extend battery life. Key indicators here include:
- Energy Impact: An estimate of each app’s power consumption.
- 12 hr Power: Shows power usage over the past 12 hours.
- App Nap: Indicates if an app is in “App Nap” mode, a macOS feature that reduces power usage for inactive apps.
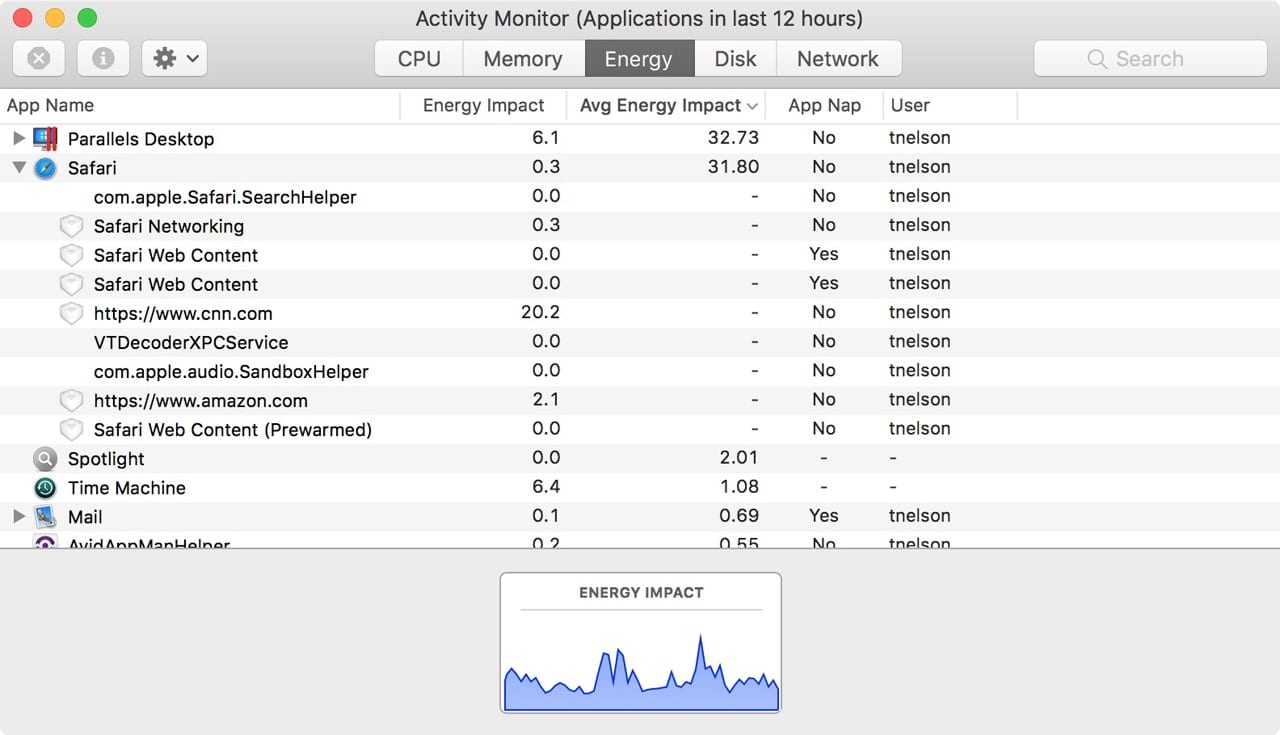
If your battery life is draining quickly, use this tab to see which applications are consuming the most energy.
4. Disk Tab
The Disk tab shows data on read and write operations to your Mac’s storage. Each process’s disk usage is displayed with:
- Bytes Read: Data read from disk by each process.
- Bytes Written: Data written to disk by each process.
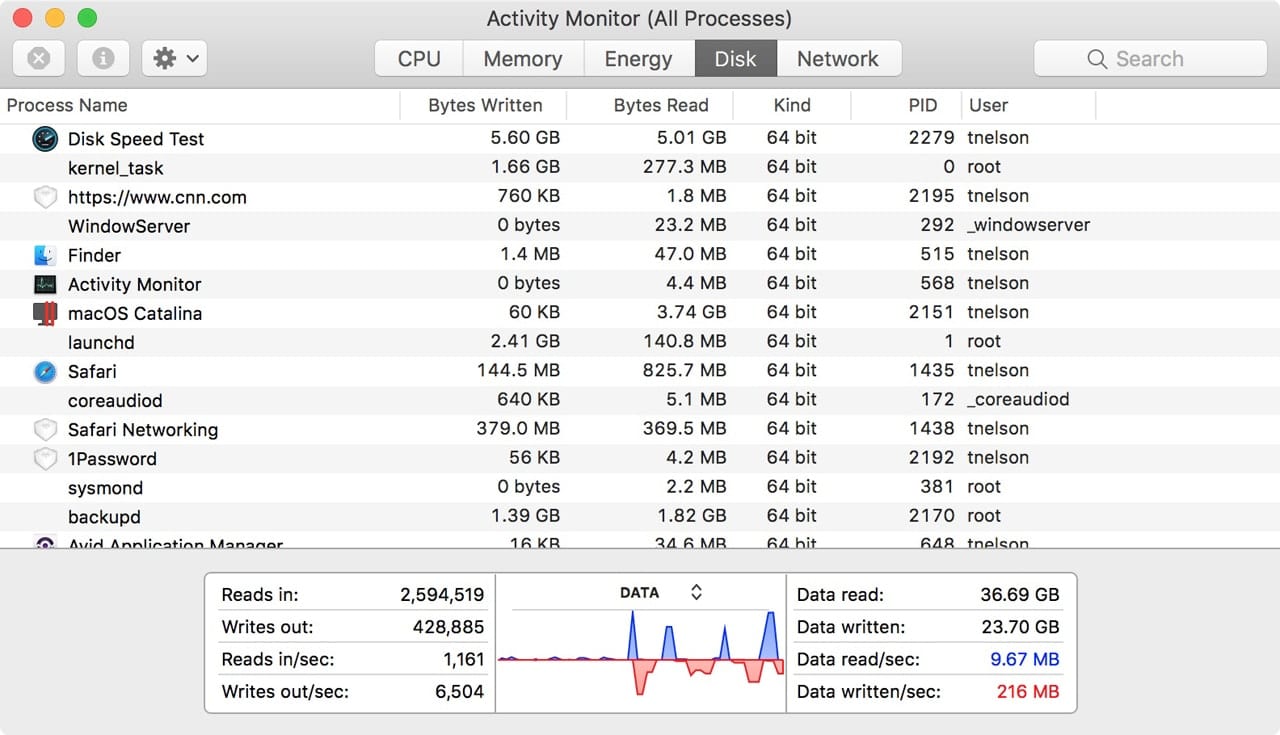
This tab helps monitor processes that may be writing or reading excessively, which could indicate background processes that are slowing down your Mac.
5. Network Tab
The Network tab provides information on data sent and received over the network. This is particularly helpful for identifying apps or processes using a significant amount of internet data.
- Sent Bytes: Data sent by each process.
- Received Bytes: Data received by each process.
- Packets In/Out: The number of packets received or sent by each process.
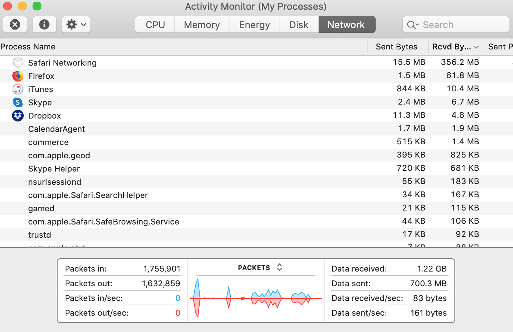
If your internet is slower than expected, use this tab to identify any background applications that may be using bandwidth.
How to Force Quit Applications Using Activity Monitor
One of the essential features of Activity Monitor is the ability to force quit applications that are unresponsive or using too many system resources.
- Step 1: In Activity Monitor, locate the application or process you want to close.
- Step 2: Click on the application to select it.
- Step 3: Click on the Stop (X) button in the top left corner of Activity Monitor.
- Step 4: Choose Force Quit from the options that appear.
Force quitting an application should only be done if the app is unresponsive or causing system issues, as it may result in unsaved data loss.
Monitoring Mac Performance with Activity Monitor
Activity Monitor is a versatile tool for monitoring performance and diagnosing issues on your Mac. Here are some additional tips for using it effectively:
- Monitor Memory Pressure: In the Memory tab, check the Memory Pressure graph at the bottom to see if your Mac needs additional RAM.
- System-Wide Overview: Use the Window > CPU Usage or CPU History options to get a visual overview of CPU usage over time.
- Stay Informed: Keep Activity Monitor open while running heavy applications to monitor your system’s real-time performance.
Conclusion
Activity Monitor is the macOS equivalent of Windows Task Manager and provides a comprehensive view of your Mac’s resource usage. By understanding the tabs and knowing how to force quit unresponsive applications, you can keep your Mac running smoothly and troubleshoot potential issues effectively. With this guide, you should now feel confident using Activity Monitor to monitor and manage processes on your Mac.
