A Complete Guide to Converting Tables to Ranges and Ranges to Tables in Excel

Working with data in Microsoft Excel often involves using tables to organize and manage information efficiently. Excel tables offer many features, including automatic filtering, sorting, and formatting. However, sometimes you may want to convert a table back to a simple range or vice versa. This comprehensive guide will walk you through the steps to convert a table to a range and convert a range back to a table, making your data management seamless and flexible.
What is an Excel Table?
An Excel table is a dynamic way to organize data. Tables automatically adjust their formatting, provide headers, and make it easier to work with functions like sorting and filtering. Tables can expand and contract as you add or remove rows and columns, and they automatically apply consistent styles.
Why Convert a Table to a Range?
There are times when working with an Excel table might limit your needs. For example:
- Complex Formulas: Tables can sometimes cause confusion with certain formulas that reference large datasets.
- Customization: If you prefer to have more control over your formatting and structure, converting the table into a normal range might be the better option.
When a table is converted back to a range, Excel removes the table formatting but leaves the data intact.
How to Convert a Table to a Range
Step-by-Step Guide to Converting a Table to a Range
- Select the Table: Click anywhere inside the table that you want to convert to a range. This will activate the table-specific options in the Ribbon.
- Go to the Table Tools: Once your table is selected, you’ll see a Table Tools Design tab appear on the Ribbon.
- Click on Convert to Range: In the Table Tools Design tab, you’ll find an option labeled Convert to Range. Click on it.
- Confirm the Action: A dialog box will pop up, asking you if you’re sure you want to convert the table to a normal range. Click Yes to proceed.
After these steps, your table will now be a simple range of data, though it will still retain its formatting. However, the table features like sorting and filtering will no longer be automatically available.
Example:

Why Convert a Range to a Table?
Converting a normal range to a table in Excel has its advantages:
- Ease of Management: Tables provide built-in filters and sorting options for easy data manipulation.
- Dynamic Ranges: As you add more data, the table automatically expands.
- Improved Formatting: Excel automatically applies alternating row colors and header formatting, making it easier to read and work with large data sets.
How to Convert a Range to a Table
Step-by-Step Guide to Converting a Range to a Table
- Select the Range: Highlight the range of cells that you want to convert into a table. Make sure your range includes column headers if you want them to be part of the table.
- Go to the Insert Tab: Click on the Insert tab in the Ribbon, located at the top of your screen.
- Click on Table: In the Insert tab, you’ll find a button labeled Table. Click on it to open the Create Table dialog box.
- Confirm the Range and Headers: Excel will automatically detect the range of cells. Make sure the “My table has headers” option is checked if your data has headers.
- Click OK: After confirming the range and headers, click OK. Excel will now convert your selected range into a table with all the built-in functionalities.
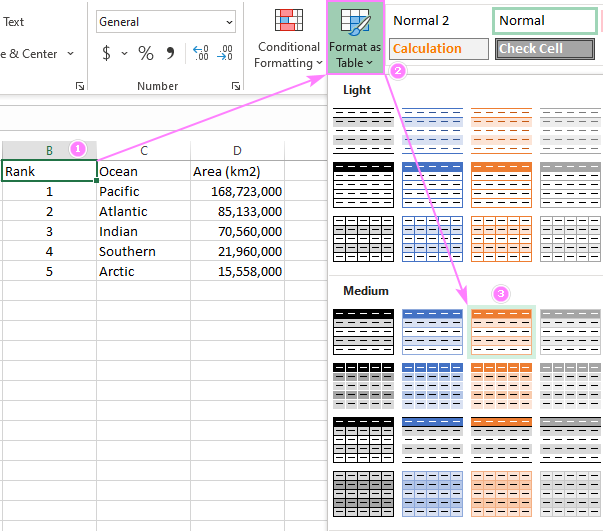
Example:

Additional Features When Using Tables
Tables in Excel come with several built-in features that can improve data management:
- Automatic Sorting and Filtering: Each column in the table comes with a filter dropdown, allowing you to easily sort or filter your data.
- Structured References: When using formulas, Excel tables use structured references, making it easier to understand and manage large datasets.
- Automatic Expansion: Tables automatically expand to include new rows or columns as data is added. You don’t need to manually update ranges in formulas.
- Table Styles: Excel tables come with pre-designed styles that automatically apply alternating row colors and other formatting features to improve readability.
Converting a Table to a Range: Pros and Cons
While tables are useful, there are times when converting them to a range is the better option. Below are some pros and cons of converting tables to ranges.
Pros:
- Easier to apply custom formatting.
- Simpler when using complex formulas.
- Avoids potential issues with structured references.
Cons:
- Loss of automatic filtering and sorting.
- No longer dynamically updates as new data is added.
Converting a Range to a Table: Pros and Cons
Using tables can significantly enhance your productivity, but it may not always be the best option, depending on your needs.
Pros:
- Built-in sorting and filtering features.
- Dynamic ranges that expand as data grows.
- Easier to apply consistent formatting.
Cons:
- Can sometimes cause confusion with complex formulas.
- May limit your flexibility with certain types of formatting.
Conclusion
Whether you’re converting a table to a range or a range to a table, Excel provides flexible options to suit your data management needs. Tables are excellent for managing dynamic datasets with ease, while ranges offer more control for custom formulas and formatting. Now that you understand how to make these conversions, you can switch between tables and ranges seamlessly, improving your efficiency in Excel.
