Step-by-Step Guide to Sales Forecasting in Excel

Sales forecasting is an essential tool for businesses to predict future sales and make informed decisions. Excel offers powerful features that allow you to create accurate sales forecasts using historical data, formulas, and charts. In this guide, we’ll walk you through the process of building a sales forecast in Excel, helping you to visualize trends, anticipate future sales, and make strategic business decisions.
1. Why Use Excel for Sales Forecasting?
Excel is a versatile tool for sales forecasting because it allows businesses to:
- Analyze Historical Data: Use past sales performance to identify trends and patterns.
- Visualize Sales Trends: Create charts and graphs that display forecasts visually.
- Automate Forecasting: Use built-in functions and formulas to automate projections.
- Customizable Models: Tailor forecasts to meet specific business needs, such as seasonal trends or market fluctuations.
Excel’s flexibility and range of tools make it an ideal choice for sales forecasting, regardless of your business size.
2. Gathering and Organizing Sales Data

Before building a forecast, it’s crucial to gather accurate historical sales data. You can collect data such as:
- Monthly or Quarterly Sales: Data points that show how your sales have fluctuated over time.
- Units Sold: The number of products sold within a particular period.
- Revenue: Income generated from sales within the specified timeframe.
Once gathered, organize your data in a clean and consistent format in Excel. Typically, you’d have one column for time (months, quarters, or years) and another column for sales figures.
Example Table:
| Month | Sales ($) |
|---|---|
| Jan | 15,000 |
| Feb | 18,000 |
| Mar | 22,000 |
| Apr | 19,000 |
| May | 25,000 |
| Jun | 30,000 |
3. Using Excel’s FORECAST Function

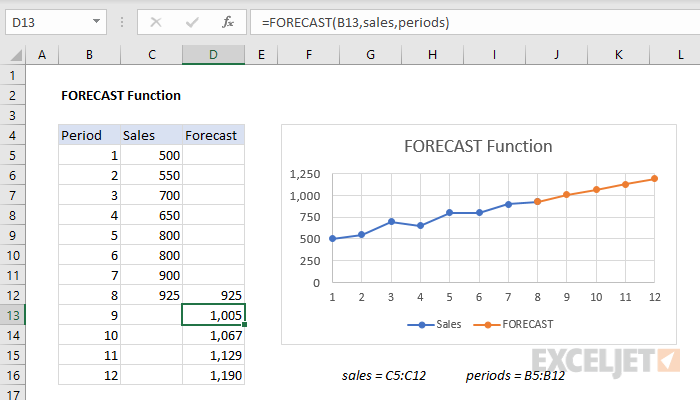
Excel’s FORECAST function is a powerful tool that predicts future values based on historical data. It uses linear regression to project sales based on existing trends.
Step-by-Step Guide to Using the FORECAST Function:
- Enter Your Historical Data:
- In one column, enter your time series data (e.g., months). In the adjacent column, enter your historical sales figures.
- Select the Cell for Your Forecast:
- Click on the cell where you want the forecasted value to appear.
- Enter the FORECAST Formula:
- Type the formula:
=FORECAST(target_date,sales_range,time_range)=FORECAST(target\_date, sales\_range, time\_range)
- Example:
=FORECAST(7, B2:B7, A2:A7)will forecast the sales for the 7th month based on the first 6 months of data.
- Press ‘Enter’:
- Excel will calculate the forecasted sales value for the specified target period.
4. Using Excel’s Forecast Sheet Feature
Excel also offers a built-in Forecast Sheet tool, which generates forecasts and charts automatically.
Step-by-Step Guide to Creating a Forecast Sheet:
- Highlight Your Data:
- Select the historical sales data, including the time series and sales figures.
- Go to the ‘Data’ Tab:
- On the Excel ribbon, click on the “Data” tab.
- Click on ‘Forecast Sheet’:
- In the Forecast group, click “Forecast Sheet.”
- Choose a Forecast Type:
- Choose either a line chart or column chart to visualize your forecast.
- Set Forecast Options:
- You can adjust the end date, confidence interval, and other forecast settings in the options panel.
- Click ‘Create’ to Generate the Forecast:
- Click “Create,” and Excel will insert the forecast along with a chart into your worksheet.
5. Visualizing Your Sales Forecast

Visualizing your sales forecast helps in better understanding trends and making informed decisions. Excel provides a range of chart types that make it easier to analyze your data.
Step-by-Step Guide to Creating a Sales Forecast Chart:
- Select the Data Range:
- Highlight the time series and sales forecast data.
- Go to the ‘Insert’ Tab:
- Click on the “Insert” tab in the Excel ribbon.
- Choose a Chart Type:
- Select a line or column chart to visualize your forecast.
- Customize the Chart:
- Modify the chart title, axis labels, and formatting to make the chart more readable and relevant to your audience.
- Analyze the Trends:
- Use the chart to analyze seasonal trends, identify peak sales periods, and anticipate future sales growth.
6. Advanced Techniques for Sales Forecasting
For more advanced forecasting, Excel offers additional functions and tools, such as:
- Moving Averages: Smooth out fluctuations in sales data by calculating averages over a period.
- Exponential Smoothing: Excel’s ETS function is used for more complex forecasting, taking into account seasonality and trends.
- Regression Analysis: Use regression techniques to identify relationships between sales and other variables, such as advertising spend or market conditions.
These techniques help refine your sales forecast, providing more accuracy and insight into future sales performance.
7. Best Practices for Sales Forecasting in Excel
To ensure accurate and reliable sales forecasts, follow these best practices:
- Use Clean and Accurate Data: Ensure that your historical sales data is accurate and free from errors.
- Regularly Update Data: Update your forecast regularly with new sales figures to keep it accurate.
- Consider External Factors: Account for seasonality, promotions, and market changes that may affect your sales.
- Use Different Forecasting Models: Test various forecasting methods to find the one that best fits your data.
Conclusion
Sales forecasting in Excel is a powerful tool that helps businesses predict future sales, identify trends, and make data-driven decisions. By using Excel’s built-in functions like FORECAST and Forecast Sheet, you can easily create accurate forecasts based on historical data.
By following the steps in this guide, you’ll be able to create your own sales forecasts and visualize them with charts. To further refine your forecasts, consider using advanced techniques like moving averages and exponential smoothing. Regularly updating your forecast with fresh data ensures it remains relevant and accurate for your business needs.
