Ways to Monitor CPU Temperature on Windows 10/11

Monitoring your CPU temperature is crucial for maintaining your computer’s health. Overheating can lead to reduced performance, system instability, or even hardware damage. Windows 10 and 11 do not provide a built-in tool to directly check the CPU temperature, but there are several third-party apps and BIOS settings that can help. In this guide, we’ll walk you through the easiest ways to check your CPU temperature on Windows 10 and 11.
Why Should You Monitor CPU Temperature?
Your CPU (Central Processing Unit) is the brain of your computer, and it generates heat when processing tasks. If your CPU becomes too hot, it can throttle its performance to cool down or even shut down your system to prevent damage. By monitoring your CPU temperature, you can ensure your system is running efficiently and avoid potential overheating issues.
1. Check CPU Temperature Using BIOS/UEFI

One of the simplest ways to check your CPU temperature is directly through the BIOS or UEFI settings.
Step 1: Access the BIOS/UEFI
- Restart your computer.
- During startup, press the key specific to your computer model (often F2, Delete, or Esc) to enter the BIOS/UEFI settings.
Step 2: Locate CPU Temperature Information
- Inside the BIOS/UEFI menu, look for a section labeled Hardware Monitor or PC Health Status.
- In this section, you should see a readout of your CPU temperature. It will usually be displayed in degrees Celsius (°C).
While this method provides a simple way to check your CPU temperature, it requires a restart and doesn’t allow real-time monitoring while using your computer.
2. Using Core Temp to Monitor CPU Temperature

If you prefer real-time monitoring of your CPU temperature without restarting your computer, Core Temp is a lightweight and easy-to-use application.
Step 1: Download and Install Core Temp
- Visit the official Core Temp website.
- Download and install the application on your computer.
Step 2: Open Core Temp
- Once installed, launch Core Temp. The main window will display the temperature of each individual CPU core.
Step 3: Monitor Your CPU Temperature
- You can check the current temperature as well as the Min and Max temperatures for each core.
- Core Temp also provides additional information like CPU load, clock speed, and power consumption.
This application is perfect for users who want to monitor their CPU temperature while gaming or running intensive applications.
3. Monitor CPU Temperature with HWMonitor

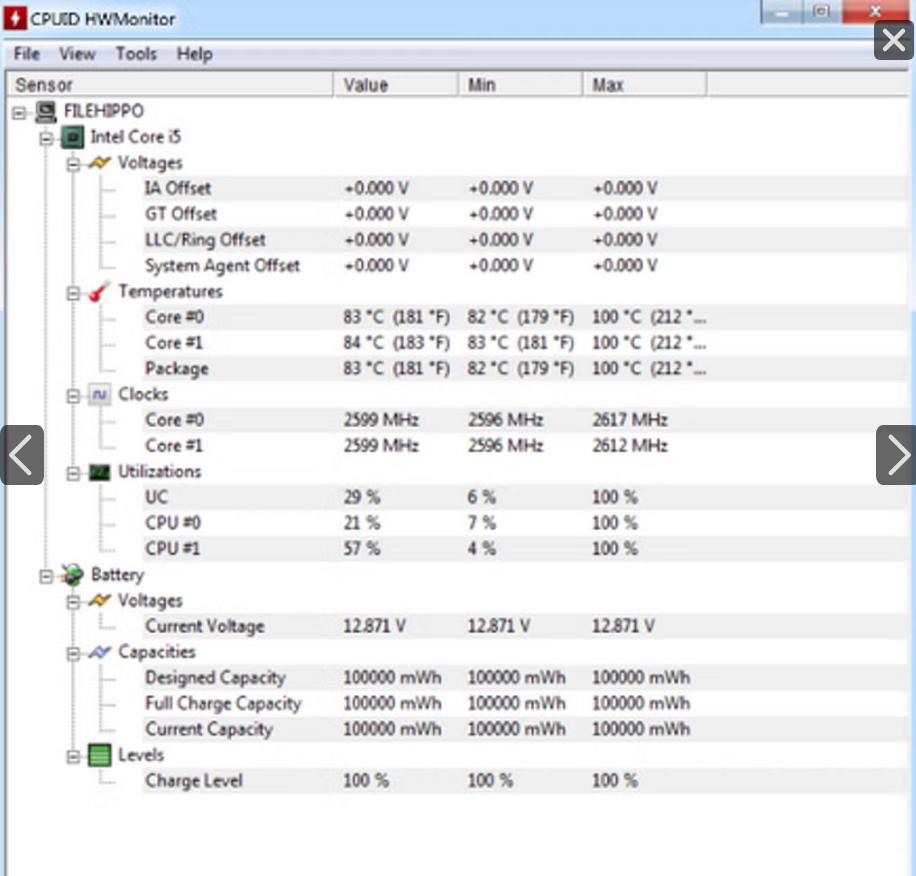
Another popular tool for checking CPU temperature and overall system health is HWMonitor. It provides detailed information about your computer’s hardware, including CPU temperature, fan speed, and voltage.
Step 1: Download and Install HWMonitor
- Go to the CPUID website and download the latest version of HWMonitor.
- Install the software on your computer.
Step 2: Run HWMonitor
- Open the HWMonitor application.
- In the main window, you’ll find your CPU listed along with detailed statistics like core temperature, power usage, and fan speeds.
Step 3: Analyze the Results
- Under the Temperatures section, you can check the current, minimum, and maximum temperatures of your CPU cores.
HWMonitor provides more comprehensive hardware monitoring, making it ideal for users who want in-depth insights into their system’s performance.
4. Checking CPU Temperature with MSI Afterburner

MSI Afterburner is a popular tool for gamers, providing not only CPU temperature monitoring but also GPU and system monitoring features.
Step 1: Download MSI Afterburner
- Visit the official MSI Afterburner page and download the software.
- Install it on your system.
Step 2: Set Up CPU Temperature Monitoring
- Launch MSI Afterburner.
- Navigate to Settings and under the Monitoring tab, check the option to display CPU Temperature.
Step 3: View Temperature in Real-Time
- MSI Afterburner can display CPU temperature in the main interface and even as an overlay during gaming, making it a favorite among gamers and power users.
5. Check CPU Temperature in Task Manager (Windows 11)

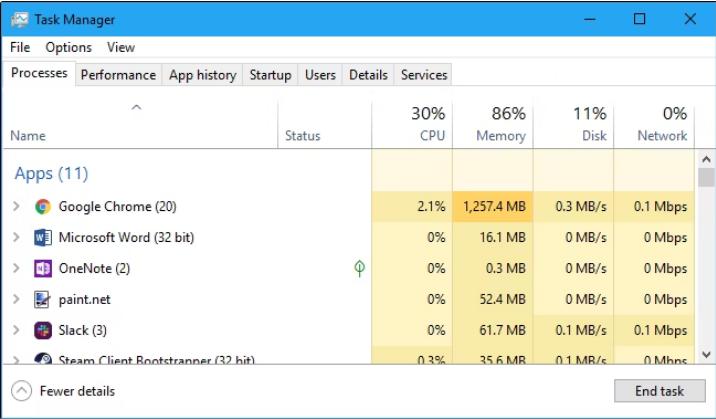
Although the Task Manager in Windows 11 doesn’t show CPU temperature directly, it provides valuable information about CPU usage and performance. For detailed temperature monitoring, you’ll still need third-party software like Core Temp or HWMonitor.
Step 1: Open Task Manager
- Press Ctrl + Shift + Esc to open Task Manager.
- Go to the Performance tab and select CPU to view CPU usage, clock speed, and other details.
While the Task Manager doesn’t show CPU temperature, it can be useful for identifying performance issues or CPU throttling, which may indicate overheating.
What Is a Safe CPU Temperature?
A safe temperature range for most CPUs is between 40°C to 70°C during typical use. If your CPU exceeds 80°C during heavy workloads like gaming or rendering, you may need to improve cooling. Extended exposure to temperatures above 90°C can damage your CPU.
Conclusion
Monitoring your CPU temperature is essential to prevent overheating and maintain your computer’s performance. While Windows 10 and 11 don’t have built-in temperature monitoring, tools like Core Temp, HWMonitor, and MSI Afterburner offer real-time temperature tracking and detailed hardware information. By regularly checking your CPU temperature, you can avoid hardware issues and ensure your system runs smoothly for years to come.
