Excel Learning Guide: Mastering Spreadsheets and Data Analysis

Microsoft Excel is more than just a spreadsheet program; it’s a powerful tool for data analysis, financial modeling, project management, and much more. Whether you’re a beginner or looking to refine your skills, mastering Excel can significantly enhance your productivity and analytical capabilities. This comprehensive guide will provide you with essential tips and step-by-step instructions to help you become proficient in Excel, making you a spreadsheet and data analysis expert.
1. Why Excel is Essential for Data Analysis
Excel is an essential tool for data analysis due to its versatility and user-friendly interface. It provides various functions, formulas, and tools that allow users to manipulate data, perform calculations, create visualizations, and generate reports.
Key Benefits of Using Excel for Data Analysis:
- Wide Range of Functions: Excel offers numerous built-in functions for statistical, mathematical, financial, and logical operations.
- Data Visualization Tools: Easily create charts, graphs, and pivot tables to visualize data trends and patterns.
- Customizable and Flexible: Users can create custom formulas and tools to suit specific data analysis needs.
- Integration with Other Tools: Excel integrates seamlessly with other Microsoft Office tools and various data sources.
Understanding the versatility of Excel will help you make the most of its capabilities in your data analysis tasks.
2. Getting Started with Excel: Basic Functions and Formulas
To master Excel, start by familiarizing yourself with its basic functions and formulas.
Common Excel Functions:
- SUM: Adds all the numbers in a range.
- Formula:
=SUM(A1:A10)
- Formula:
- AVERAGE: Calculates the average of numbers in a range.
- Formula:
=AVERAGE(A1:A10)
- Formula:
- IF: Performs a logical test and returns different values depending on the outcome.
- Formula:
=IF(A1>10, "Above 10", "10 or Below")
- Formula:
- VLOOKUP: Searches for a value in the first column of a table and returns a value in the same row from a specified column.
- Formula:
=VLOOKUP(B2, A2:C10, 3, FALSE)
- Formula:
Step-by-Step Guide to Entering Formulas:
- Select a Cell: Click on the cell where you want to enter the formula.
- Type the Formula: Begin typing your formula with an equal sign
=. - Enter Arguments: Input the necessary range or values for your formula.
- Press Enter: Complete the formula by pressing
Enter, and Excel will display the result.
3. Leveraging Excel’s Data Analysis Tools
Excel offers several powerful tools specifically designed for data analysis, such as PivotTables, Data Analysis Toolpak, and Solver.
3.1 Using PivotTables for Data Analysis

PivotTables allow you to quickly summarize large datasets, providing a dynamic way to analyze data by sorting, counting, and aggregating.
Step-by-Step Guide to Creating a PivotTable:
- Select Your Data Range: Highlight the range of data you want to include in your PivotTable.
- Go to ‘Insert’ > ‘PivotTable’: Click on the “Insert” tab and then “PivotTable.”
- Choose the PivotTable Location: Decide whether to place the PivotTable in a new worksheet or an existing one.
- Drag Fields to the PivotTable Areas: In the PivotTable Field List, drag fields to the Rows, Columns, Values, and Filters areas as needed.
3.2 Utilizing the Data Analysis Toolpak

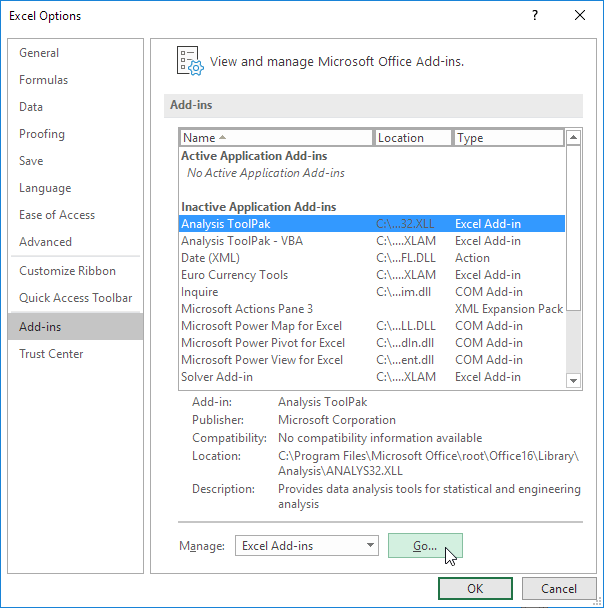
The Data Analysis Toolpak is an Excel add-in that provides advanced data analysis tools such as regression, ANOVA, and descriptive statistics.
Step-by-Step Guide to Enabling the Data Analysis Toolpak:
- Go to ‘File’ > ‘Options’: Click on “Options” in the backstage view.
- Select ‘Add-Ins’: Choose “Excel Add-ins” and click “Go.”
- Check ‘Analysis ToolPak’: Ensure the “Analysis ToolPak” checkbox is selected and click “OK.”
4. Advanced Excel Skills: Macros and VBA
For users looking to automate repetitive tasks or create complex data models, Excel’s Macros and VBA (Visual Basic for Applications) provide advanced customization and automation capabilities.
Creating a Simple Macro:
- Go to ‘View’ > ‘Macros’ > ‘Record Macro’: Click on “Record Macro” to start recording.
- Perform Your Tasks: Execute the steps you want the macro to perform.
- Stop Recording: Click on “Macros” again and select “Stop Recording.”
Using VBA for Custom Functions:
- Open the VBA Editor: Press
Alt + F11to open the VBA editor. - Insert a New Module: Go to “Insert” > “Module” to create a new module.
- Write Your VBA Code: Enter your custom VBA code in the module window.
5. Tips for Mastering Excel for Data Analysis
To become proficient in Excel, consider the following tips:
- Practice Regularly: Regular practice is essential for mastering Excel’s vast array of functions and tools.
- Use Keyboard Shortcuts: Familiarize yourself with Excel keyboard shortcuts to enhance productivity.
- Stay Updated with New Features: Keep up with Excel’s updates to take advantage of new features and tools.
- Join Excel Communities: Participate in Excel forums and communities to learn from other users and share knowledge.
Conclusion
Excel is a powerful tool for data analysis, offering a wide range of functions, tools, and capabilities that cater to both beginners and advanced users. By understanding the basics, leveraging built-in tools like PivotTables and the Data Analysis Toolpak, and exploring advanced features like Macros and VBA, you can master Excel and significantly enhance your data analysis skills.
Regular practice and continuous learning are key to becoming an Excel expert. With the tips and techniques provided in this guide, you’ll be well on your way to mastering spreadsheets and data analysis in Excel. If you need further assistance or want to explore more advanced topics, consider joining Excel training programs or consulting Excel’s official resources.
