Excel Quick Analysis Feature: Effortlessly Optimize Data Analysis
Excel is a powerhouse for data manipulation and analysis, but sometimes you need quick insights without diving into complex formulas or pivot tables. That’s where the Quick Analysis tool comes in. This handy feature allows you to instantly visualize, summarize, and gain valuable insights from your data with just a few clicks.
What is the Quick Analysis Tool?
The Quick Analysis tool is a small icon that appears at the bottom right corner of a selected data range in Excel. It provides a menu of options for quickly analyzing and formatting your data, including:
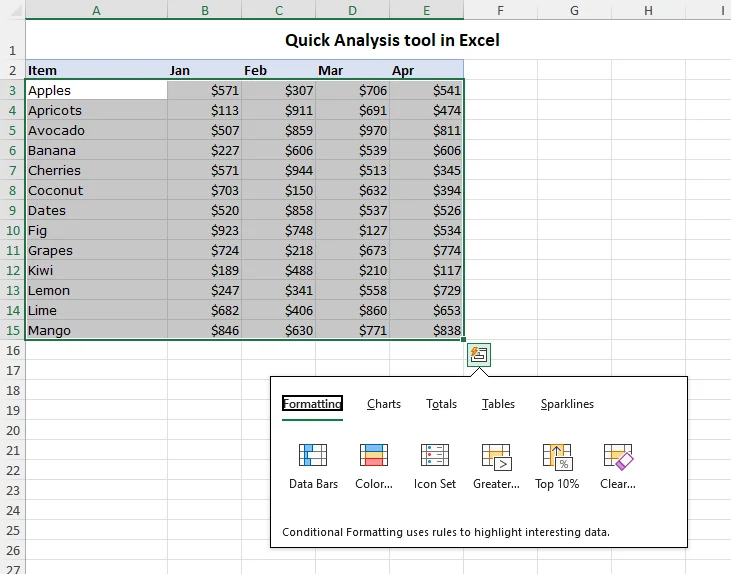
- Formatting: Apply conditional formatting to highlight trends and patterns.
- Charts: Create various charts (bar, column, line, pie, etc.) to visualize your data.
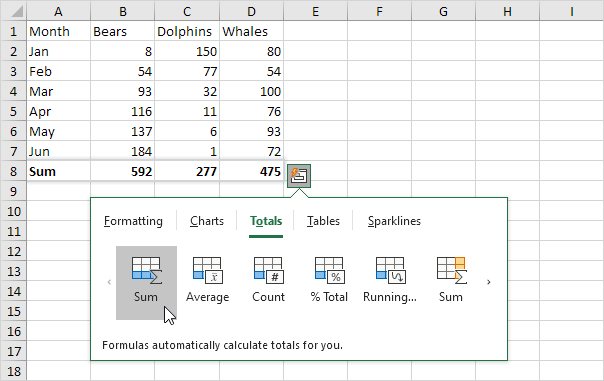
- Totals: Calculate sums, averages, counts, and other summary statistics.
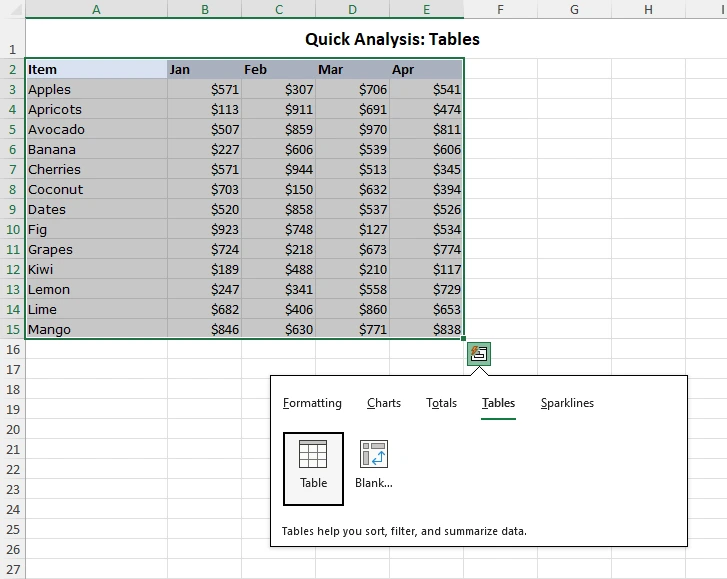
- Tables: Convert your data into a table for easier filtering and sorting.
- Sparklines: Add miniature charts within cells to show trends over time.
How to Use the Quick Analysis Tool
-
-
Select Your Data: Highlight the range of cells you want to analyze.
-
Click the Quick Analysis Icon: The icon will appear at the bottom right corner of your selection. Click it to open the Quick Analysis menu.
-
- Choose an Option: Hover over each option to see a live preview of how it will affect your data. Click the option you want to apply.
Examples of Quick Analysis in Action
- Formatting: Highlight the top 10% of sales figures in green.
- Charts: Create a bar chart to compare sales by region.
- Totals: Calculate the total sales for the year.
- Tables: Convert your sales data into a table for easy filtering.
- Sparklines: Add a sparkline to each row to show sales trends over time.
Benefits of Using the Quick Analysis Tool
- Speed: Get instant insights without having to create formulas or pivot tables.
- Ease of Use: The intuitive interface makes it easy for anyone to analyze data.
- Versatility: A wide range of options for formatting, visualizing, and summarizing data.
- Efficiency: Streamline your workflow and save time on data analysis tasks.
Tips for Using the Quick Analysis Tool
- Experiment: Try different options to see which one best suits your needs.
- Customize: Most Quick Analysis options can be customized to fit your preferences.
- Combine: Use multiple Quick Analysis options together to get a more comprehensive view of your data.
- Learn More: Explore Excel’s help resources to discover all the features and capabilities of the Quick Analysis tool.
Conclusion
The Quick Analysis tool is a valuable asset for anyone who works with data in Excel. It’s a quick and easy way to gain insights, visualize trends, and make informed decisions. By mastering this tool, you can streamline your data analysis process and unlock the full potential of your spreadsheets.
Related articles
» Excel Camera Tool: Capture and Display Dynamic Visuals in Your Spreadsheets
» Microsoft Excel vs Google Sheets: Which is the Right Spreadsheet Tool
» Excel Data Analysis: Tools for Visualization, Modeling, Regression, and More


