SAAC's Team
May 14, 2024
How to Create Graph Paper in Excel: A Detailed Tutorial

Excel is a versatile tool that can be used for more than just spreadsheets. With a few simple adjustments, you can transform your Excel worksheet into printable graph paper, perfect for creating charts, diagrams, or even playing games.
Why Print Graph Paper from Excel?
- Convenience: Easily create graph paper without needing specialized software or templates.
- Customization: Adjust the grid size and style to fit your specific needs.
- Flexibility: Print as many sheets as you need, whenever you need them.
- Cost-Effective: No need to purchase pre-printed graph paper.
How to Print Graph Paper in Excel
-
- Adjust Row Height and Column Width:

- Select all cells in the worksheet (click the triangle in the top left corner of the sheet).
- Right-click on any row number and select “Row Height.”
- Enter a value for the row height (e.g., 0.5 for a smaller grid, 1 for a larger grid).
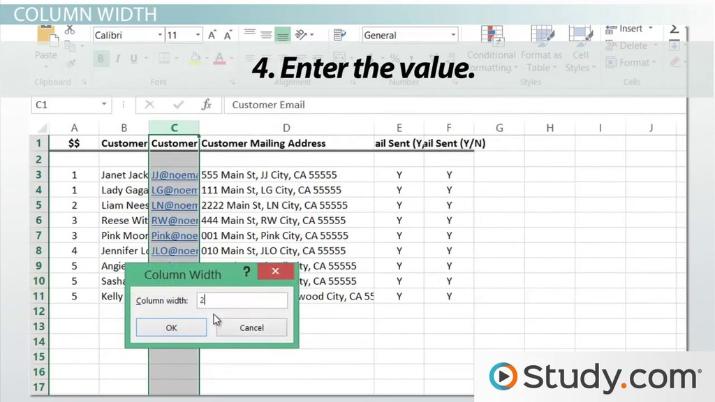
- Right-click on any column letter and select “Column Width.”
- Enter the same value as the row height to create square cells.
-
- Apply Borders:

- With all cells still selected, go to the “Home” tab in the ribbon.
- In the “Font” group, click the “Borders” button.
- Select “All Borders” to apply borders to all sides of each cell.
-
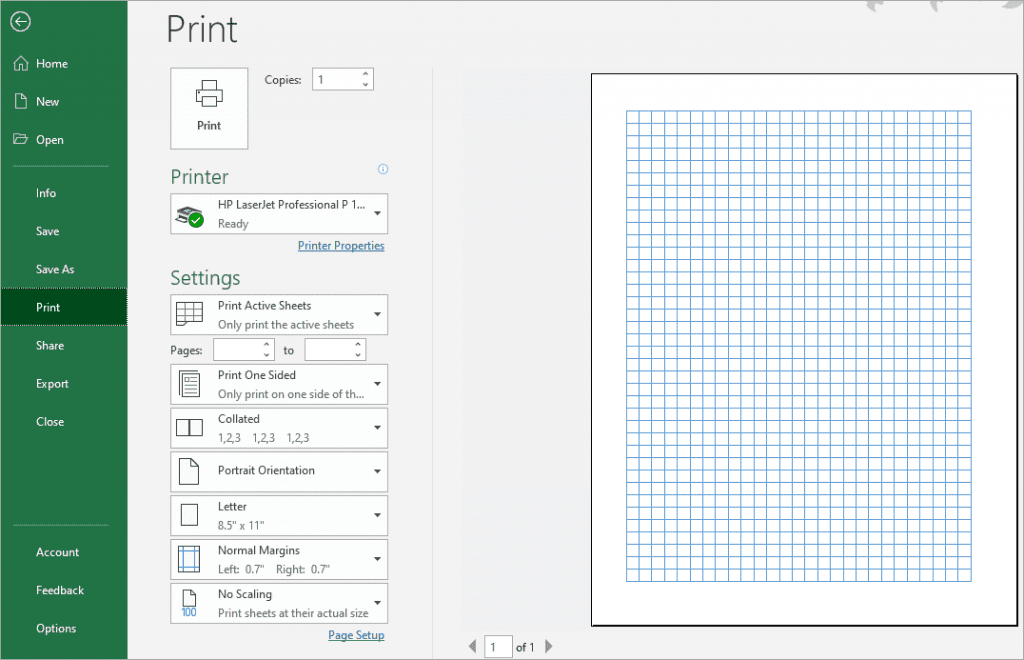
- Print Preview (Optional):

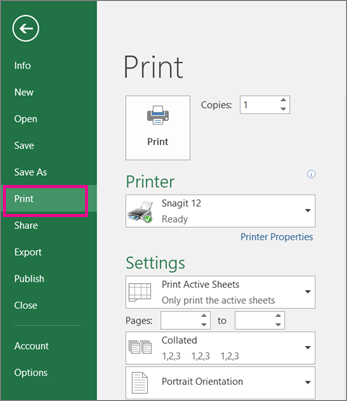
- Go to the “File” tab and select “Print” to preview the graph paper.
- Adjust the “Scale to Fit” options to fit the grid to your desired page size.
- Print:
- Click the “Print” button to print your graph paper.
Customizing Your Graph Paper
- Grid Size: Adjust the row height and column width to create different grid sizes.
- Line Style: Experiment with different border styles (solid, dashed, dotted) to create unique grid patterns.
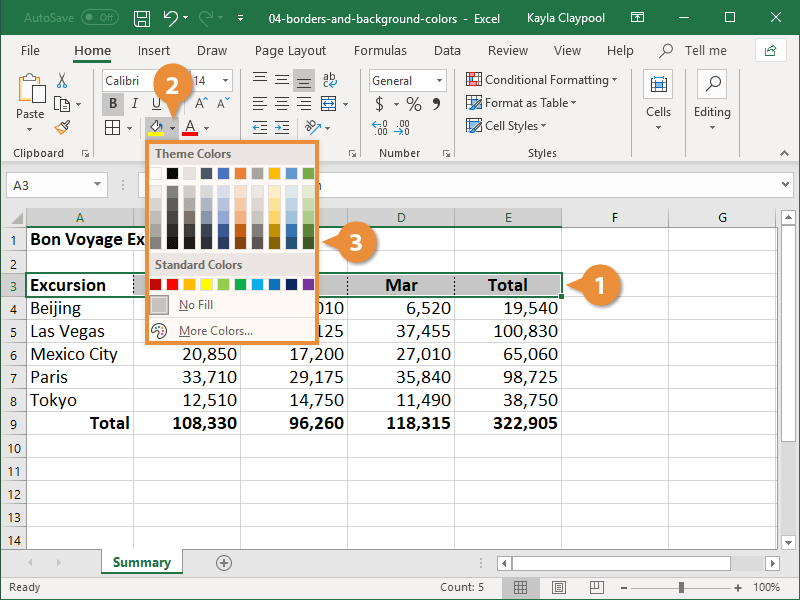
- Color: Change the border color to make your graph paper more visually appealing.
Additional Tips:
- Use the Page Layout Tab: The “Page Layout” tab offers additional options for customizing your graph paper, such as margins and page orientation.
- Save as a Template: Save your customized graph paper as an Excel template for future use.
- Print on Different Paper: Experiment with printing on different types of paper, such as cardstock or colored paper, for a more unique look.
Conclusion
Printing graph paper in Excel is a simple and convenient way to create custom grids for various purposes. Whether you’re a student, teacher, engineer, or artist, this versatile tool can help you bring your ideas to life on paper. By following the steps outlined in this guide, you can easily create and print graph paper that meets your specific needs.
Related articles
» How To Print Gridlines in Excel
» How to Create a Bar Graph in Excel
» How to Make a Line Graph in Excel – Step by Step Guide
