10 Simple Steps to Create a Pivot Chart in Excel
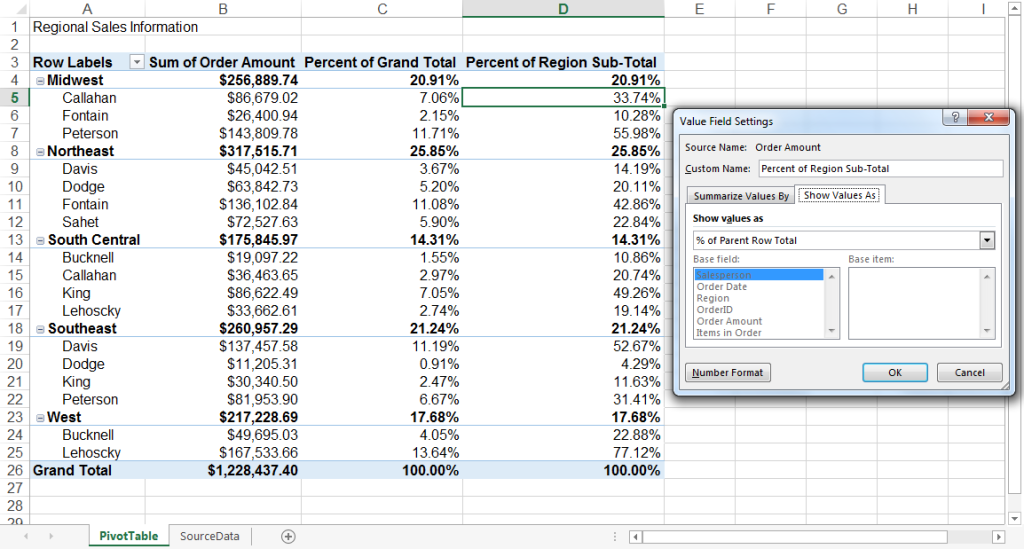
10 Simple Steps to Create a Pivot Chart in Excel Pivot charts in Excel are dynamic and interactive tools that transform your raw data into insightful visuals. They allow you to summarize, analyze, and present complex datasets with ease, making it simpler to identify trends, patterns, and outliers. This step-by-step guide will walk you through…
