Tag: Data Visualization

Excel Conditional Formatting Made Simple: A Beginner’s Guide – 2024

Excel Conditional Formatting Made Simple: A Beginner’s Guide – 2024

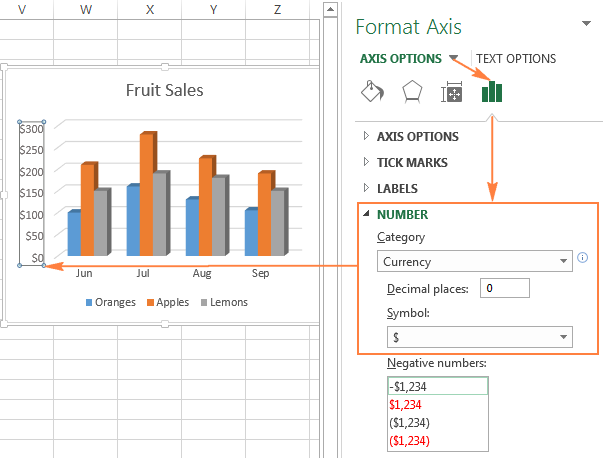
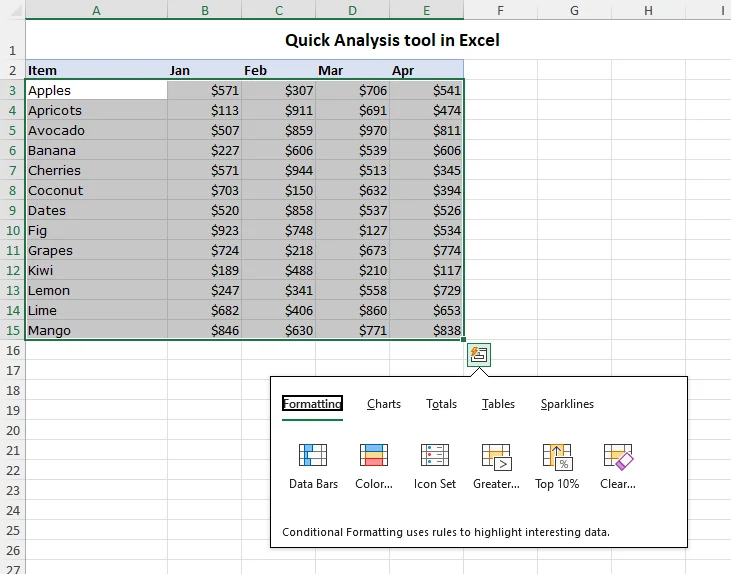
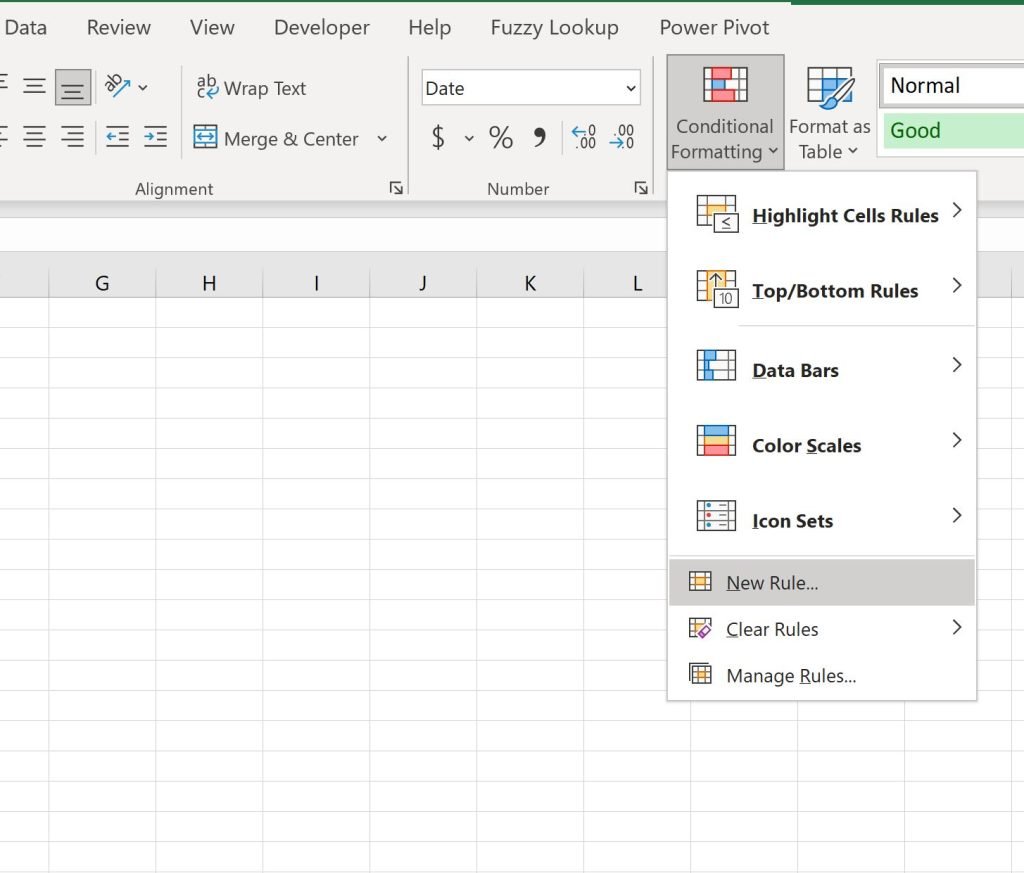
Excel Conditional Formatting Made Simple: A Beginner’s Guide Excel’s conditional formatting is a powerful tool that allows you to dynamically change the appearance of cells based on specific criteria. Whether you want to highlight top performers, flag deadlines, or visualize data trends, conditional formatting can transform your spreadsheets into insightful dashboards. This tutorial will guide…

Excel for Experts: Key Features and Capabilities – 2024

Excel for Experts: Key Features and Capabilities – 2024

Excel for Experts: Key Features and Capabilities Microsoft Excel is a cornerstone of data analysis, reporting, and decision-making in the professional world. While its basic functions are widely known, mastering Excel’s advanced features can significantly enhance your productivity and unlock valuable insights from your data. This comprehensive guide will explore essential Excel features and functionalities…

Excel Proficiency: Top 23 Skills Across Basic, Intermediate, and Advanced Levels

Excel Proficiency: Top 23 Skills Across Basic, Intermediate, and Advanced Levels

Excel Proficiency: Top 23 Skills Across Basic, Intermediate, and Advanced Levels Excel is a versatile and powerful tool used in various industries for data analysis, organization, and visualization. Whether you’re a beginner or an expert, mastering Excel skills can significantly enhance your productivity and open doors to new career opportunities. This comprehensive guide will outline…

Excel Data Analysis: Charting, Modeling, Regression, and Beyond – 2024

Excel Data Analysis: Charting, Modeling, Regression, and Beyond – 2024

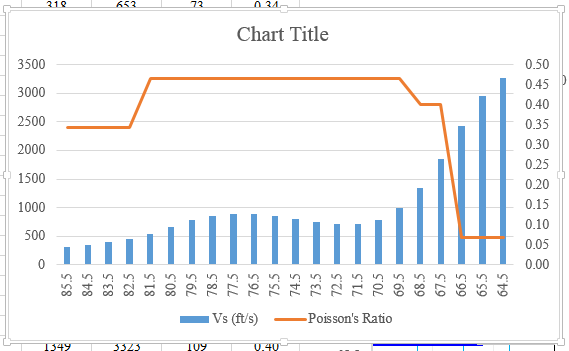
Excel Data Analysis: Charting, Modeling, Regression, and Beyond Excel is a powerhouse for data analysis, offering a wide range of tools and features to transform raw data into actionable insights. This comprehensive guide will delve into the various aspects of data analysis in Excel, from basic visualization to advanced modeling and regression techniques. Why Excel…

Top 10 Microsoft Excel Fonts to Improve Readability and Aesthetics

Top 10 Microsoft Excel Fonts to Improve Readability and Aesthetics

Top 10 Microsoft Excel Fonts to Improve Readability and Aesthetics Choosing the right font for your Excel spreadsheets can significantly impact readability, professionalism, and overall visual appeal. Whether you’re creating financial reports, data visualizations, or simple lists, the font you choose plays a crucial role in conveying your message effectively. Why Font Choice Matters in…