Understanding Z-Score in Excel: Explanation and Examples
What is a Z-Score?
In statistics, a Z-score (also known as a standard score) is a numerical measurement that describes a value’s relationship to the mean of a group of values. It’s measured in terms of standard deviations from the mean.
- Positive Z-score: The data point is above the mean.
- Negative Z-score: The data point is below the mean.
- Zero Z-score: The data point is equal to the mean.
Z-scores allow you to compare data points from different datasets on a standardized scale, making it easier to interpret and analyze your data.
Why Use Z-Scores in Excel?
Excel is a powerful tool for calculating and visualizing Z-scores. Here’s why you’d want to use them:
- Outlier Detection: Identify unusually high or low values within your dataset.
- Data Standardization: Compare data points from different datasets with varying scales and units.
- Probability Calculation: Determine the likelihood of a certain value occurring within your dataset.
How to Calculate Z-Scores in Excel
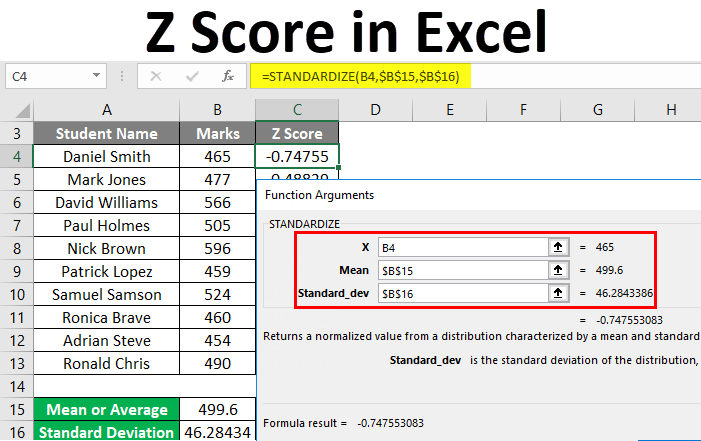
Excel provides a simple function, STANDARDIZE, to calculate Z-scores:
=STANDARDIZE(x, mean, standard_dev)
Where:
x: The value you want to convert to a Z-scoremean: The average of your datasetstandard_dev: The standard deviation of your dataset
Example: Analyzing Exam Scores
Let’s say you have a set of exam scores. Here’s how to calculate Z-scores in Excel:
-
Organize Your Data: Enter your exam scores in a column (e.g., column A).
-
Calculate Mean and Standard Deviation:
- In a separate cell, calculate the mean using
=AVERAGE(A1:A10)(adjust the range as needed). - In another cell, calculate the standard deviation using
=STDEV.S(A1:A10).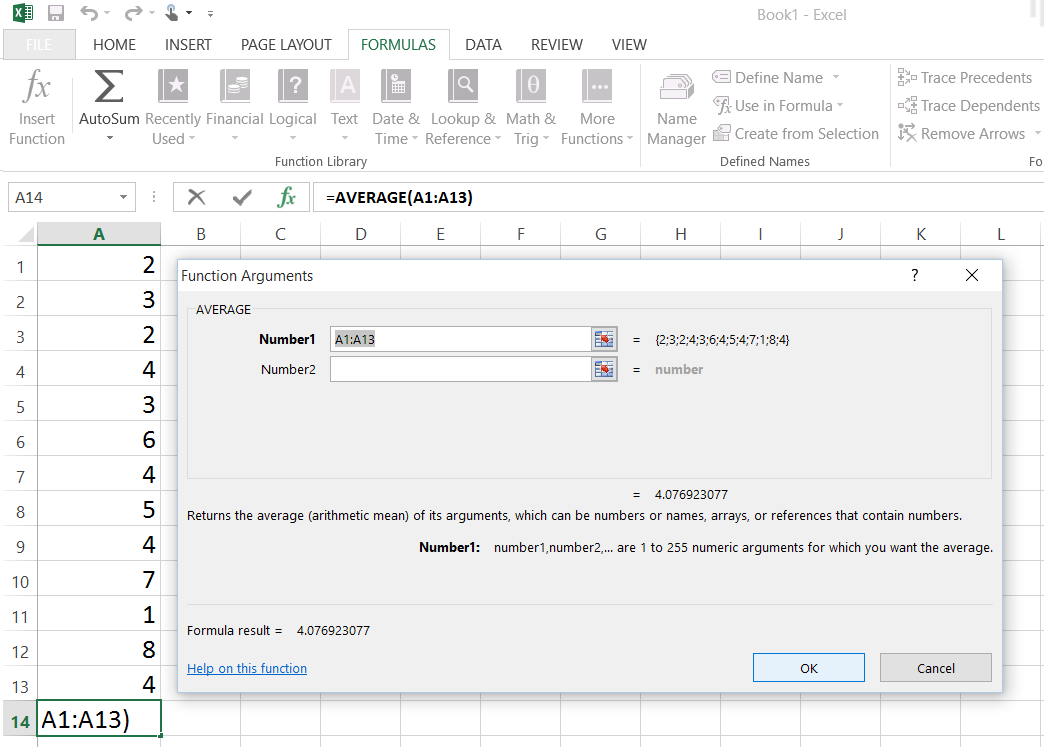
- In a separate cell, calculate the mean using
-
Calculate Z-Scores:
- In a new column (e.g., column B), enter the formula:
=STANDARDIZE(A1, [mean cell reference], [standard deviation cell reference]) - Drag the formula down to calculate Z-scores for all exam scores.
- In a new column (e.g., column B), enter the formula:
Interpreting Z-Scores
Now you have a column of Z-scores. Here’s how to interpret them:
- A Z-score of 0 means the score is exactly at the average.
- A Z-score of 1 means the score is one standard deviation above the average.
- A Z-score of -1.5 means the score is one and a half standard deviations below the average.
Visualizing Z-Scores
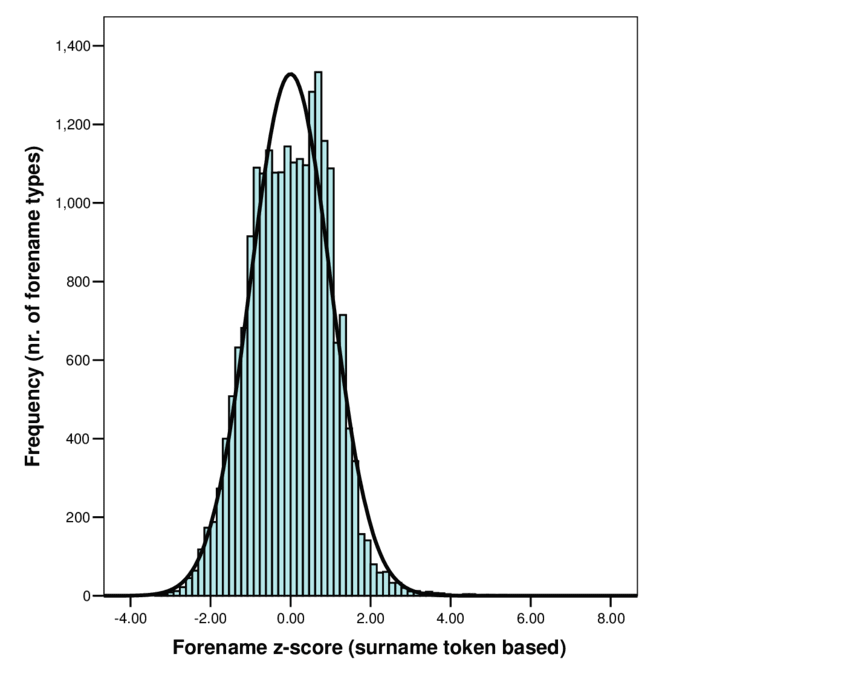
You can create a histogram to visualize the distribution of your Z-scores. This helps you see how your data is spread out and identify any outliers.
Key Points
- Z-scores are a powerful statistical tool for data analysis.
- Excel makes it easy to calculate and visualize Z-scores.
- Understanding Z-scores can help you gain valuable insights from your data.

