Computing Standard Deviation in Excel: A Detailed Tutorial

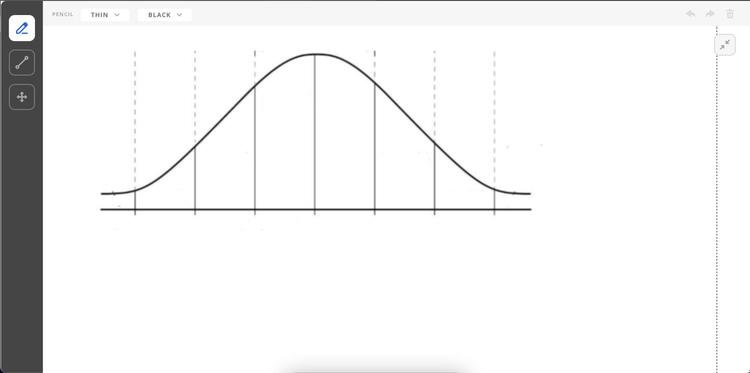
Standard deviation is a powerful statistical tool that measures the amount of variation or dispersion in a set of data. In simpler terms, it tells you how spread out the numbers are from the average (mean). Excel makes calculating standard deviation a breeze, even if you’re not a statistics whiz.
Why Standard Deviation Matters
- Understanding Variability: Standard deviation helps you gauge how consistent or volatile your data is. A low standard deviation indicates the data points are clustered around the mean, while a high standard deviation signals more spread-out values.
- Quality Control: In manufacturing or other processes, standard deviation can help identify outliers or defects.
- Financial Analysis: It’s used to assess risk and volatility in investment portfolios.
- Scientific Research: Standard deviation is crucial for analyzing experimental results and drawing meaningful conclusions.
Types of Standard Deviation in Excel

Excel offers two main functions for calculating standard deviation:
- STDEV.S: This function calculates the standard deviation of a sample. Use this when your data represents a subset of a larger population.
- STDEV.P: This function calculates the standard deviation of an entire population. Use this when you have data for every member of the group you’re analyzing.
How to Calculate Standard Deviation in Excel (Step-by-Step)
-
Organize Your Data:

- Enter your data into a column or row in your Excel spreadsheet.
-
Choose the Right Function:
- Decide whether your data is a sample (STDEV.S) or a population (STDEV.P).
-
Enter the Formula:
- In an empty cell, type the following formula, replacing “data_range” with the actual range of cells containing your data:
- For sample standard deviation:
=STDEV.S(data_range) - For population standard deviation:
=STDEV.P(data_range)
- For sample standard deviation:
- In an empty cell, type the following formula, replacing “data_range” with the actual range of cells containing your data:
-
Press Enter:
- Excel will instantly calculate and display the standard deviation.
Example
Let’s say your data is in cells A1 through A10:
- Sample Standard Deviation:
=STDEV.S(A1:A10) - Population Standard Deviation:
=STDEV.P(A1:A10)
Interpreting the Results
The standard deviation value you get tells you, on average, how far each data point is from the mean. A higher standard deviation means your data is more spread out.
Tips and Tricks
- Descriptive Statistics Tool: Excel has a built-in tool that can calculate standard deviation along with other statistics. Go to the “Data” tab, click “Data Analysis,” and select “Descriptive Statistics.”
- Array Formulas: If you need to calculate standard deviation for multiple datasets at once, you can use array formulas (enter with Ctrl+Shift+Enter).
Important Note

- Be sure to choose the correct function (STDEV.S or STDEV.P) based on whether you have a sample or population data.
- If your data contains text or logical values, they will be ignored in the calculation.
Related Articles
» How to Calculate Standard Deviation in Excel
» How to Add Standard Deviation Bars in Excel
» How To Calculate a P-Value in Excel


